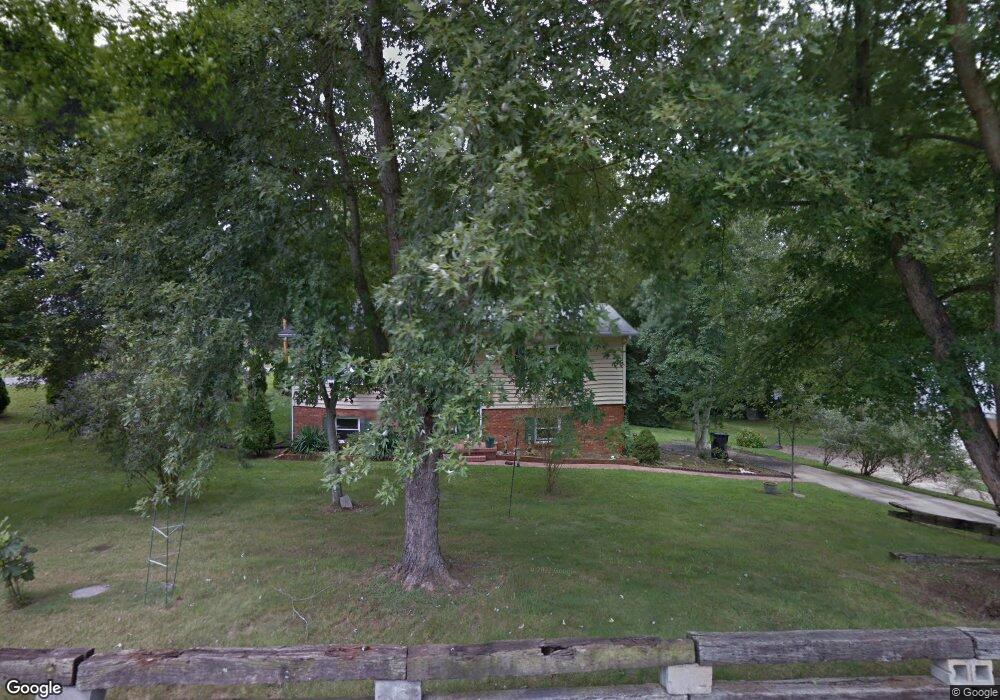
101 Drexel Dr Morganton, NC 28655
Estimated Value: $276,922 - $368,000
3
Beds
2
Baths
1,965
Sq Ft
$166/Sq Ft
Est. Value
About This Home
This home is located at 101 Drexel Dr, Morganton, NC 28655 and is currently estimated at $325,981, approximately $165 per square foot. 101 Drexel Dr is a home located in Burke County with nearby schools including Drexel Elementary School, Heritage Middle School, and Jimmy C. Draughn High School.
Ownership History
Date
Name
Owned For
Owner Type
Purchase Details
Closed on
Aug 16, 2023
Sold by
Mcgimpsey Ajeshajuan D and Mcgimpsey Aaliyah
Bought by
Mcgimpsey Ajeshajuan D and Mcgimpsey Aaliyah
Current Estimated Value
Home Financials for this Owner
Home Financials are based on the most recent Mortgage that was taken out on this home.
Original Mortgage
$190,000
Outstanding Balance
$184,919
Interest Rate
6.81%
Mortgage Type
New Conventional
Estimated Equity
$141,062
Purchase Details
Closed on
Feb 27, 2018
Sold by
Jnh Properties Llc
Bought by
Mcgimpsey Ajeshajuan D
Home Financials for this Owner
Home Financials are based on the most recent Mortgage that was taken out on this home.
Original Mortgage
$142,222
Interest Rate
4.04%
Mortgage Type
New Conventional
Purchase Details
Closed on
Aug 22, 2017
Sold by
Otwell David Q and Welsh Mary Jeanne
Bought by
Jnh Properties Llc
Purchase Details
Closed on
Jul 14, 2017
Sold by
Trustmark National Bank
Bought by
Otwell David Q and Otwell Perry Sandra Kay
Purchase Details
Closed on
Jul 10, 2007
Sold by
Hood Claudette B
Bought by
Trustmark National Bank and Deborah O Griffin Trust
Create a Home Valuation Report for This Property
The Home Valuation Report is an in-depth analysis detailing your home's value as well as a comparison with similar homes in the area
Home Values in the Area
Average Home Value in this Area
Purchase History
| Date | Buyer | Sale Price | Title Company |
|---|---|---|---|
| Mcgimpsey Ajeshajuan D | -- | None Listed On Document | |
| Mcgimpsey Ajeshajuan D | -- | None Listed On Document | |
| Mcgimpsey Ajeshajuan D | $140,000 | None Available | |
| Jnh Properties Llc | -- | Attorney | |
| Otwell David Q | -- | Attorney | |
| Trustmark National Bank | $110,000 | None Available |
Source: Public Records
Mortgage History
| Date | Status | Borrower | Loan Amount |
|---|---|---|---|
| Open | Mcgimpsey Ajeshajuan D | $190,000 | |
| Closed | Mcgimpsey Ajeshajuan D | $190,000 | |
| Previous Owner | Mcgimpsey Ajeshajuan D | $142,222 |
Source: Public Records
Tax History
| Year | Tax Paid | Tax Assessment Tax Assessment Total Assessment is a certain percentage of the fair market value that is determined by local assessors to be the total taxable value of land and additions on the property. | Land | Improvement |
|---|---|---|---|---|
| 2025 | $1,968 | $206,686 | $13,125 | $193,561 |
| 2024 | $1,250 | $206,686 | $13,125 | $193,561 |
| 2023 | $1,245 | $206,686 | $13,125 | $193,561 |
| 2022 | $1,038 | $137,489 | $11,250 | $126,239 |
| 2021 | $1,032 | $137,489 | $11,250 | $126,239 |
| 2020 | $1,028 | $137,489 | $11,250 | $126,239 |
| 2019 | $1,028 | $137,489 | $11,250 | $126,239 |
| 2018 | $699 | $90,209 | $11,250 | $78,959 |
| 2017 | $670 | $86,260 | $11,250 | $75,010 |
| 2016 | $652 | $86,260 | $11,250 | $75,010 |
| 2015 | $649 | $86,260 | $11,250 | $75,010 |
| 2014 | $647 | $86,260 | $11,250 | $75,010 |
| 2013 | $647 | $86,260 | $11,250 | $75,010 |
Source: Public Records
Map
Nearby Homes
- 308 Park Ave Unit 310
- 102 Page St
- 606 Park Ave
- 100 Reed St
- 505 Mimosa Ave
- 111 Baxter St
- 113 Williams Way
- 221 Valdese Dr
- 3435 Nelson Ln
- 203 Cohen St
- 3219 US 70 E
- 2269 Drexel Heights St
- 225 Baxter St
- 0 Buford Dr
- 1761 Dearborn Street Extension
- 1720 Bumgarner Dr
- 3200 US 70 Hwy
- 1801 Highland Ave
- 106 River Hills Way
- 2501 US 70 E
- 108 Apartment St
- 102 Drexel Rd
- 105 Drexel Rd
- 113 Apartment St
- 104 Drexel Rd
- 109 Apartment St
- 107B Apartment St
- 107 Apartment St
- 209 Mull Ln
- 104 Apartment St
- 210 Apartment St
- 104 Apartment St
- 105 Apartment St
- 205 Mill St
- 208 Abee St
- 128 Holly Springs Ct
- 125 Holly Springs Ct
- 210 Abee St
- 212 Abee St
- 103 Apartment St
Your Personal Tour Guide
Ask me questions while you tour the home.