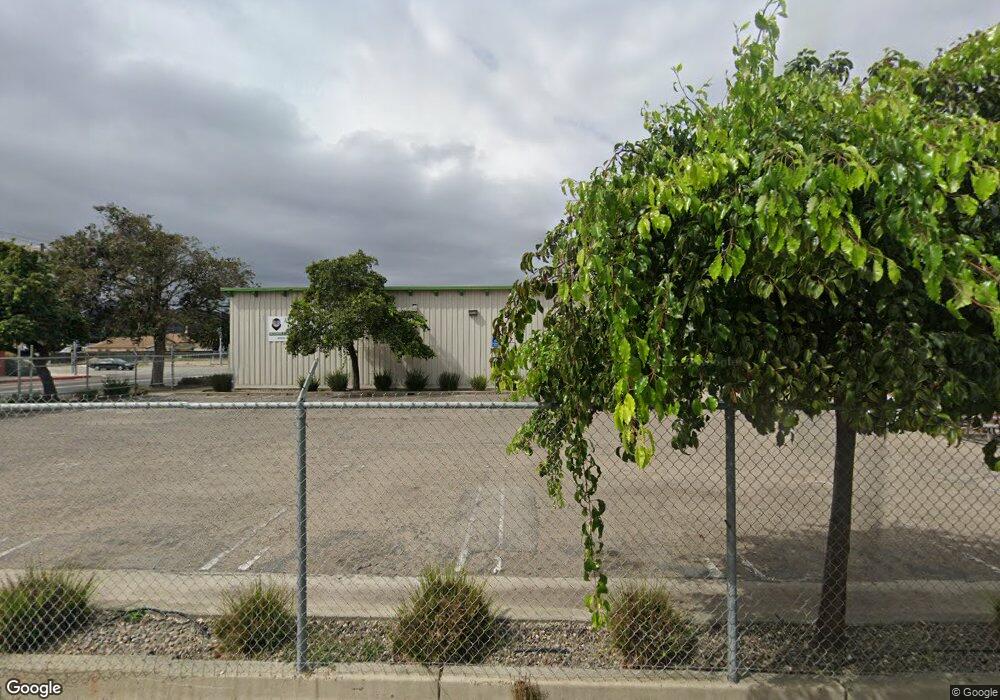
101 E Chestnut Ave Lompoc, CA 93436
Estimated Value: $813,275
Studio
--
Bath
4,567
Sq Ft
$178/Sq Ft
Est. Value
About This Home
This home is located at 101 E Chestnut Ave, Lompoc, CA 93436 and is currently estimated at $813,275, approximately $178 per square foot. 101 E Chestnut Ave is a home located in Santa Barbara County with nearby schools including Arthur Hapgood Elementary School, Lompoc Valley Middle School, and Lompoc High School.
Ownership History
Date
Name
Owned For
Owner Type
Purchase Details
Closed on
Apr 19, 2017
Sold by
Collison Jack L
Bought by
Achievement House Inc
Current Estimated Value
Purchase Details
Closed on
Feb 12, 2014
Sold by
Martin William W
Bought by
Martin William W
Purchase Details
Closed on
Jul 10, 2012
Sold by
Martin William W
Bought by
Martin William W
Purchase Details
Closed on
Jan 16, 2004
Sold by
Martin William W and Martin Carole A
Bought by
Martin William W and Martin Carole A
Purchase Details
Closed on
Jun 4, 2003
Sold by
Deutsche Bank National Trust Co
Bought by
Martin William W and Martin Carole A
Home Financials for this Owner
Home Financials are based on the most recent Mortgage that was taken out on this home.
Original Mortgage
$230,000
Interest Rate
5.61%
Mortgage Type
Commercial
Purchase Details
Closed on
Mar 3, 1994
Sold by
Borel Bank & Trust Company
Bought by
Bankers Trust Company
Create a Home Valuation Report for This Property
The Home Valuation Report is an in-depth analysis detailing your home's value as well as a comparison with similar homes in the area
Home Values in the Area
Average Home Value in this Area
Purchase History
| Date | Buyer | Sale Price | Title Company |
|---|---|---|---|
| Achievement House Inc | $495,000 | Chicago Title Company | |
| Martin William W | -- | Fidelity National Title Co | |
| Martin William W | -- | None Available | |
| Martin William W | -- | Fidelity National Title | |
| Martin William W | $340,000 | First American Title Co | |
| Bankers Trust Company | -- | Equity Title Company |
Source: Public Records
Mortgage History
| Date | Status | Borrower | Loan Amount |
|---|---|---|---|
| Previous Owner | Martin William W | $230,000 |
Source: Public Records
Tax History
| Year | Tax Paid | Tax Assessment Tax Assessment Total Assessment is a certain percentage of the fair market value that is determined by local assessors to be the total taxable value of land and additions on the property. | Land | Improvement |
|---|---|---|---|---|
| 2025 | $106 | $582,784 | $174,085 | $408,699 |
| 2023 | $106 | $553,818 | $167,326 | $386,492 |
| 2022 | $99 | $542,812 | $164,046 | $378,766 |
| 2021 | $95 | $534,418 | $160,830 | $373,588 |
| 2020 | $94 | $529,137 | $159,181 | $369,956 |
| 2019 | $90 | $518,968 | $156,060 | $362,908 |
| 2018 | $338 | $504,900 | $153,000 | $351,900 |
| 2017 | $5,055 | $424,286 | $187,185 | $237,101 |
| 2016 | $4,964 | $415,967 | $183,515 | $232,452 |
| 2015 | $4,927 | $409,720 | $180,759 | $228,961 |
| 2014 | -- | $401,695 | $177,219 | $224,476 |
Source: Public Records
Map
Nearby Homes
- 510 N I St
- 801, 851 California 246
- 117 S I St
- 533 N G St
- 526 N L St
- 215 S H St
- 217 N M St
- 205 S E St
- 610 E Pine Ave Unit 10
- 610 E Pine Ave Unit 29
- 610 E Pine Ave Unit 62
- 505 N 1st St
- 531 N O St
- 240 Quail Cir
- 425 S J St
- 321 N Third St
- 516 N 2nd St
- 1011 W Walnut Ave
- 109 S 3rd St
- 701 E Pine Ave Unit 182
Your Personal Tour Guide
Ask me questions while you tour the home.