Estimated Value: $287,000 - $341,251
4
Beds
4
Baths
2,254
Sq Ft
$141/Sq Ft
Est. Value
About This Home
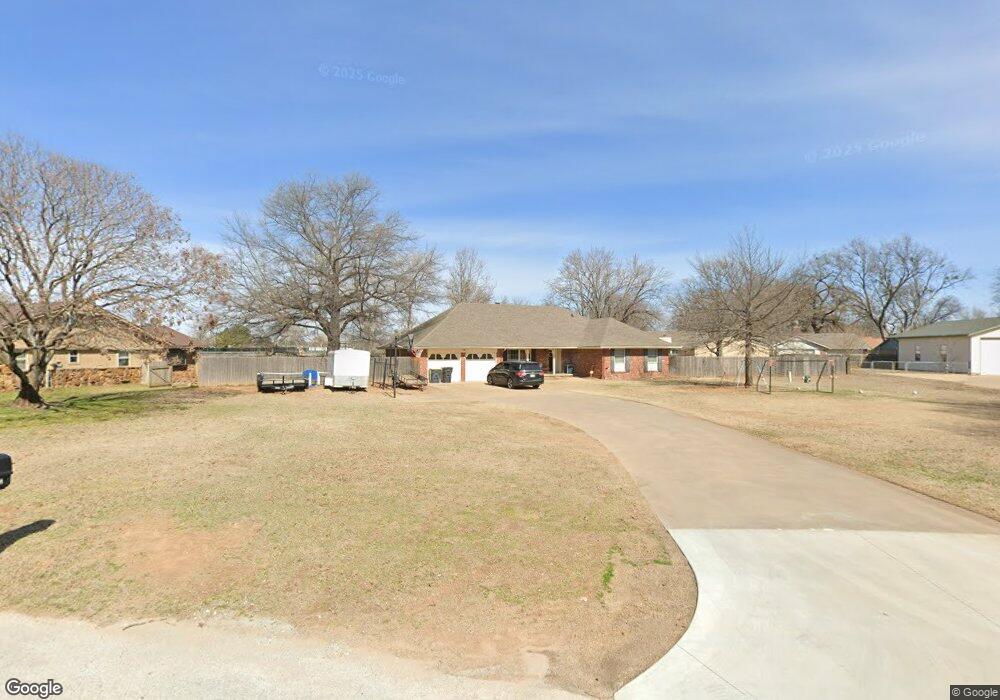
This home is located at 101 E G St, Jenks, OK 74037 and is currently estimated at $317,563, approximately $140 per square foot. 101 E G St is a home located in Tulsa County with nearby schools including Jenks West Elementary School, Jenks Middle School, and Jenks West Intermediate Elementary School.
Ownership History
Date
Name
Owned For
Owner Type
Purchase Details
Closed on
May 6, 2009
Sold by
Tucker Ray G and Tucker Darla S
Bought by
Marcangeli Eugenia K and Marcangeli Jerrod Dean
Current Estimated Value
Home Financials for this Owner
Home Financials are based on the most recent Mortgage that was taken out on this home.
Original Mortgage
$203,378
Interest Rate
4.83%
Mortgage Type
New Conventional
Purchase Details
Closed on
Mar 5, 2004
Sold by
Ewing Victor Randolph and Bowen Margaret Irene
Bought by
Tucker Ray G and Tucker Darla S
Home Financials for this Owner
Home Financials are based on the most recent Mortgage that was taken out on this home.
Original Mortgage
$139,990
Interest Rate
5.65%
Mortgage Type
Purchase Money Mortgage
Create a Home Valuation Report for This Property
The Home Valuation Report is an in-depth analysis detailing your home's value as well as a comparison with similar homes in the area
Home Values in the Area
Average Home Value in this Area
Purchase History
| Date | Buyer | Sale Price | Title Company |
|---|---|---|---|
| Marcangeli Eugenia K | $206,000 | Smith Brothers Abstract | |
| Tucker Ray G | $115,000 | -- |
Source: Public Records
Mortgage History
| Date | Status | Borrower | Loan Amount |
|---|---|---|---|
| Previous Owner | Marcangeli Eugenia K | $203,378 | |
| Previous Owner | Tucker Ray G | $139,990 |
Source: Public Records
Tax History
| Year | Tax Paid | Tax Assessment Tax Assessment Total Assessment is a certain percentage of the fair market value that is determined by local assessors to be the total taxable value of land and additions on the property. | Land | Improvement |
|---|---|---|---|---|
| 2025 | $3,519 | $28,053 | $3,427 | $24,626 |
| 2024 | $3,359 | $27,207 | $3,731 | $23,476 |
| 2023 | $3,359 | $27,385 | $3,590 | $23,795 |
| 2022 | $3,289 | $25,588 | $4,089 | $21,499 |
| 2021 | $3,231 | $24,814 | $3,965 | $20,849 |
| 2020 | $3,121 | $24,505 | $3,916 | $20,589 |
| 2019 | $3,047 | $23,761 | $3,797 | $19,964 |
| 2018 | $2,974 | $23,040 | $2,703 | $20,337 |
| 2017 | $2,837 | $23,340 | $2,738 | $20,602 |
| 2016 | $2,818 | $22,660 | $2,761 | $19,899 |
| 2015 | $2,872 | $22,660 | $2,761 | $19,899 |
| 2014 | $2,937 | $22,660 | $2,761 | $19,899 |
Source: Public Records
Map
Nearby Homes
- 204 E J St
- 1010 N 3rd St
- 321 W J St
- 408 E E St
- 549 N Elm St Unit H
- 513 W C St
- 407 N Forest St
- 504 E B St Unit 2102
- 504 E B St Unit 2101
- 504 E B St Unit 1103
- 504 E B St Unit 1104
- 422 N Forest St
- 1012 N Forest Place
- 0 E A St
- 718 E Beaver St
- 508 N Juniper St
- 1123 W F St
- 649 W 101st Place S
- 0 Aquarium Dr
- 2433 E 87th St Unit 285
Your Personal Tour Guide
Ask me questions while you tour the home.