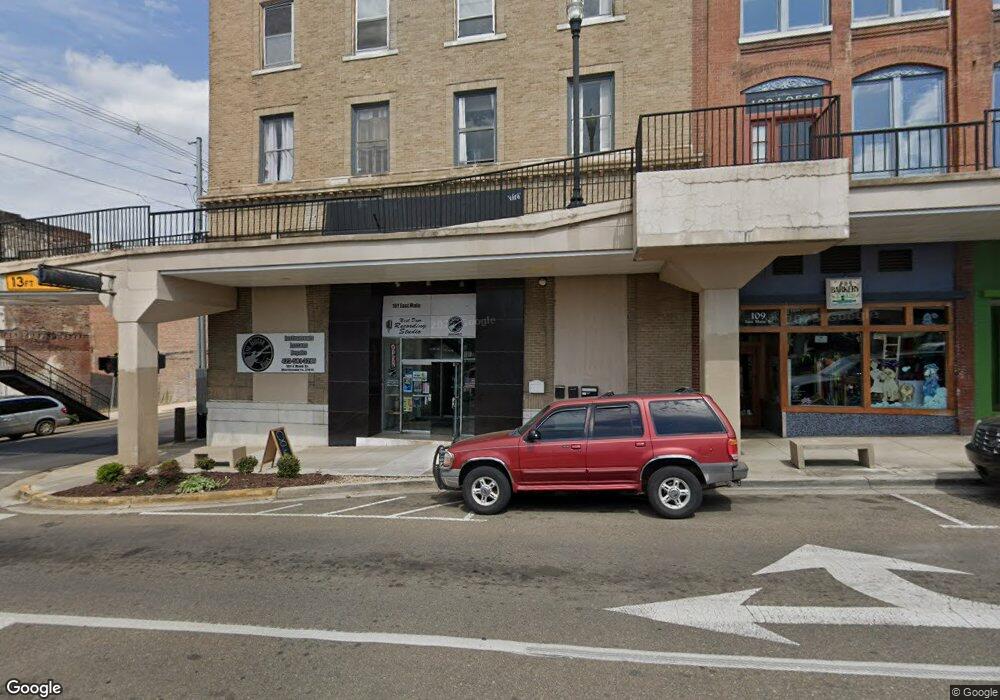
101 E Main St Unit 500 Morristown, TN 37814
Estimated Value: $711,274
--
Bed
11
Baths
2,060
Sq Ft
$345/Sq Ft
Est. Value
About This Home
This home is located at 101 E Main St Unit 500, Morristown, TN 37814 and is currently estimated at $711,274, approximately $345 per square foot. 101 E Main St Unit 500 is a home located in Hamblen County with nearby schools including Hillcrest Elementary School, Meadowview Middle School, and Morristown East High School.
Ownership History
Date
Name
Owned For
Owner Type
Purchase Details
Closed on
Apr 2, 2018
Sold by
Sarta Christina M and Timm Christina Marie
Bought by
Sarta Richard A
Current Estimated Value
Purchase Details
Closed on
Jul 19, 2004
Sold by
Dennison Vera
Bought by
Sarta Richard A
Home Financials for this Owner
Home Financials are based on the most recent Mortgage that was taken out on this home.
Original Mortgage
$69,534
Outstanding Balance
$34,783
Interest Rate
6.24%
Estimated Equity
$676,491
Purchase Details
Closed on
Jun 1, 2000
Sold by
Dennison H E Vera
Bought by
Dennison Randall A
Purchase Details
Closed on
Jun 21, 1996
Bought by
Church First United Methodist
Purchase Details
Closed on
Jan 11, 1993
Bought by
Jefferson Federal Savings & Loan Associa
Purchase Details
Closed on
Mar 20, 1992
Bought by
Heritage Federal Savings & Jefferson Fed
Purchase Details
Closed on
Dec 5, 1986
Bought by
E T B Realty Inc
Purchase Details
Closed on
Dec 30, 1975
Bought by
Cob Corp The
Create a Home Valuation Report for This Property
The Home Valuation Report is an in-depth analysis detailing your home's value as well as a comparison with similar homes in the area
Home Values in the Area
Average Home Value in this Area
Purchase History
| Date | Buyer | Sale Price | Title Company |
|---|---|---|---|
| Sarta Richard A | -- | None Available | |
| Sarta Richard A | $260,000 | -- | |
| Dennison Randall A | -- | -- | |
| Church First United Methodist | $225,000 | -- | |
| Jefferson Federal Savings & Loan Associa | -- | -- | |
| Heritage Federal Savings & Jefferson Fed | $350,000 | -- | |
| E T B Realty Inc | $220,200 | -- | |
| Cob Corp The | -- | -- |
Source: Public Records
Mortgage History
| Date | Status | Borrower | Loan Amount |
|---|---|---|---|
| Open | Cob Corp The | $69,534 |
Source: Public Records
Tax History Compared to Growth
Tax History
| Year | Tax Paid | Tax Assessment Tax Assessment Total Assessment is a certain percentage of the fair market value that is determined by local assessors to be the total taxable value of land and additions on the property. | Land | Improvement |
|---|---|---|---|---|
| 2024 | $1,747 | $99,280 | $9,360 | $89,920 |
| 2023 | $1,747 | $99,280 | $0 | $0 |
| 2022 | $3,137 | $99,280 | $9,360 | $89,920 |
| 2021 | $3,137 | $99,280 | $9,360 | $89,920 |
| 2020 | $1,386 | $99,280 | $9,360 | $89,920 |
| 2019 | $3,332 | $98,000 | $8,080 | $89,920 |
| 2018 | $3,087 | $98,000 | $8,080 | $89,920 |
| 2017 | $3,038 | $98,000 | $8,080 | $89,920 |
| 2016 | $2,901 | $98,000 | $8,080 | $89,920 |
| 2015 | $2,699 | $98,000 | $8,080 | $89,920 |
| 2014 | -- | $98,000 | $8,080 | $89,920 |
| 2013 | -- | $107,520 | $0 | $0 |
Source: Public Records
Map
Nearby Homes
- 207 E 2nd St N
- 118 E 3rd St N
- 2078 Edgewater Sound Rd
- 120 E 5th North St
- 400 E 4th St N
- 215 E 5th St N
- 311 E 4th St N
- 435 S Hill St
- 219 Inman St
- 721 E 1st St N
- 721 E 1st North St
- 529 N Jackson St
- 417 Cain Ave
- 722 W 2nd St N
- 926 E Main St
- 323 Pauline Ave
- 816 W 2nd St N
- 811 Crescent St
- 712 Williams St
- 1126 E 2nd St N
- 101 E Main St
- 109 E Main St
- 113 E Main St
- 113 E Main St
- 113 E Main St Unit A
- 113a E Main St
- 103 W Main St
- 115 S Cumberland St
- 143 E Main St
- 146 E Main St
- 115 W 1st St N
- 144 W Main St
- 121 W 1st North St
- 121 W 1st St N
- Lot 152 Hill Trail
- Lot 154 Hill Trail
- Lot 170 Hill Trail
- Lot 172 Hill Trail
- 148 W Main St
- 143 W Main St