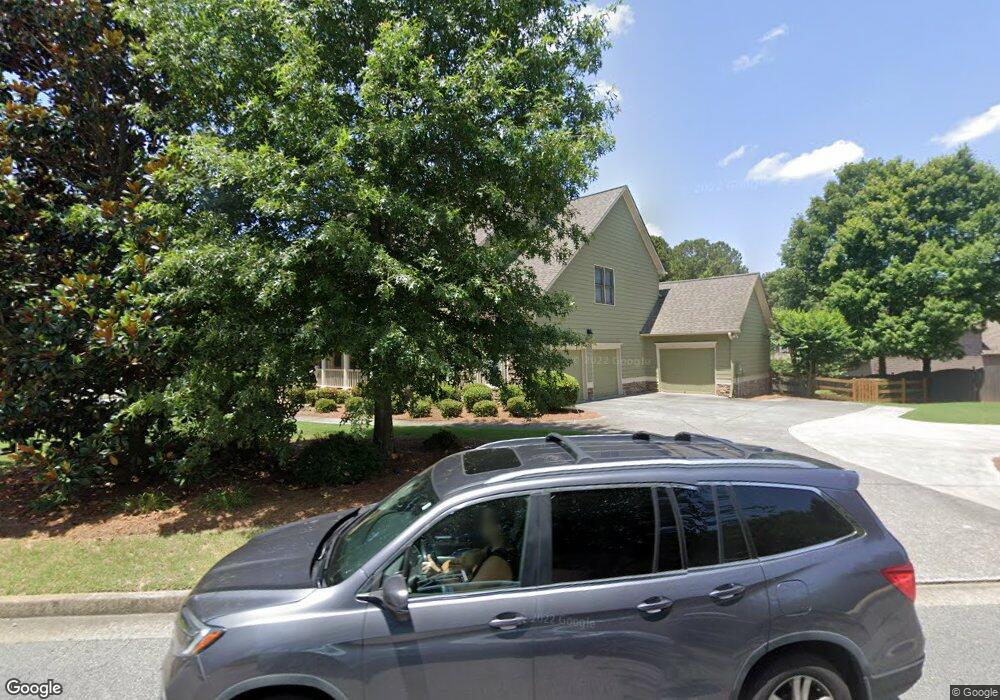
101 Gold Bridge Crossing Unit 3K Canton, GA 30114
Sutallee NeighborhoodEstimated Value: $697,902 - $768,000
5
Beds
4
Baths
3,323
Sq Ft
$221/Sq Ft
Est. Value
About This Home
This home is located at 101 Gold Bridge Crossing Unit 3K, Canton, GA 30114 and is currently estimated at $732,951, approximately $220 per square foot. 101 Gold Bridge Crossing Unit 3K is a home located in Cherokee County with nearby schools including Liberty Elementary School, Freedom Middle School, and Cherokee High School.
Ownership History
Date
Name
Owned For
Owner Type
Purchase Details
Closed on
May 10, 2006
Sold by
National Residential Nominee S
Bought by
Gillenwater Steven C and Gillenwater Nancy K
Current Estimated Value
Home Financials for this Owner
Home Financials are based on the most recent Mortgage that was taken out on this home.
Original Mortgage
$41,000
Interest Rate
6.41%
Mortgage Type
New Conventional
Purchase Details
Closed on
Nov 15, 2002
Sold by
Tih Inc
Bought by
Cates Bradley R and Cates Katharine G
Home Financials for this Owner
Home Financials are based on the most recent Mortgage that was taken out on this home.
Original Mortgage
$300,700
Interest Rate
5.95%
Mortgage Type
New Conventional
Create a Home Valuation Report for This Property
The Home Valuation Report is an in-depth analysis detailing your home's value as well as a comparison with similar homes in the area
Home Values in the Area
Average Home Value in this Area
Purchase History
| Date | Buyer | Sale Price | Title Company |
|---|---|---|---|
| Gillenwater Steven C | $410,000 | -- | |
| National Residential Nominee S | $421,000 | -- | |
| Cates Bradley R | $395,100 | -- |
Source: Public Records
Mortgage History
| Date | Status | Borrower | Loan Amount |
|---|---|---|---|
| Closed | National Residential Nominee S | $41,000 | |
| Previous Owner | Cates Bradley R | $300,700 |
Source: Public Records
Tax History Compared to Growth
Tax History
| Year | Tax Paid | Tax Assessment Tax Assessment Total Assessment is a certain percentage of the fair market value that is determined by local assessors to be the total taxable value of land and additions on the property. | Land | Improvement |
|---|---|---|---|---|
| 2024 | $6,419 | $270,520 | $56,000 | $214,520 |
| 2023 | $5,608 | $252,680 | $52,000 | $200,680 |
| 2022 | $5,396 | $218,920 | $42,000 | $176,920 |
| 2021 | $5,075 | $185,960 | $30,000 | $155,960 |
| 2020 | $4,856 | $176,320 | $30,000 | $146,320 |
| 2019 | $4,587 | $163,800 | $30,000 | $133,800 |
| 2018 | $4,396 | $156,040 | $30,000 | $126,040 |
| 2017 | $4,376 | $385,400 | $30,000 | $124,160 |
| 2016 | $4,271 | $372,500 | $30,000 | $119,000 |
| 2015 | $4,218 | $364,400 | $30,000 | $115,760 |
| 2014 | $3,946 | $340,600 | $30,000 | $106,240 |
Source: Public Records
Map
Nearby Homes
- 113 Gold Bridge Crossing
- 1383 Bridge Mill Ave
- 3085 Woodbridge Ln
- 3087 Woodbridge Ln Unit 3L
- 403 Juniper Mill Trace
- 645 Mile Branch Rd
- 0 Bells Ferry Rd Unit 10536573
- 0 Bells Ferry Rd Unit 7587917
- 312 Gold Mill Trail
- 4123 Gold Mill Ridge
- 429 Arrowhead Trail
- 410 Arrowhead Trail
- 9764 Bells Ferry Rd
- 422 Arrowhead Trail
- 2018 Boxwood Ln
- 148 Reddin Dr
- 154 Stonegate Ln
- 0 Woodbridge Ln Unit 8724120
- 0 Woodbridge Ln Unit 8621345
- 0 Woodbridge Ln Unit 8579517
- 0 Woodbridge Ln Unit 8506876
- 0 Woodbridge Ln Unit 8491076
- 0 Woodbridge Ln Unit 8453736
- 0 Woodbridge Ln Unit 8394408
- 0 Woodbridge Ln Unit 8385693
- 0 Woodbridge Ln Unit 8365808
- 0 Woodbridge Ln Unit 8272477
- 0 Woodbridge Ln Unit 8127626
- 0 Woodbridge Ln Unit 8133792
- 0 Woodbridge Ln Unit 7539545
- 0 Woodbridge Ln Unit 8365167
- 0 Woodbridge Ln Unit 8207065
- 0 Woodbridge Ln Unit 7595571
- 0 Woodbridge Ln Unit 8455027
- 0 Woodbridge Ln Unit 8739638
- 0 Woodbridge Ln Unit 8524618
- 0 Woodbridge Ln Unit 7535447