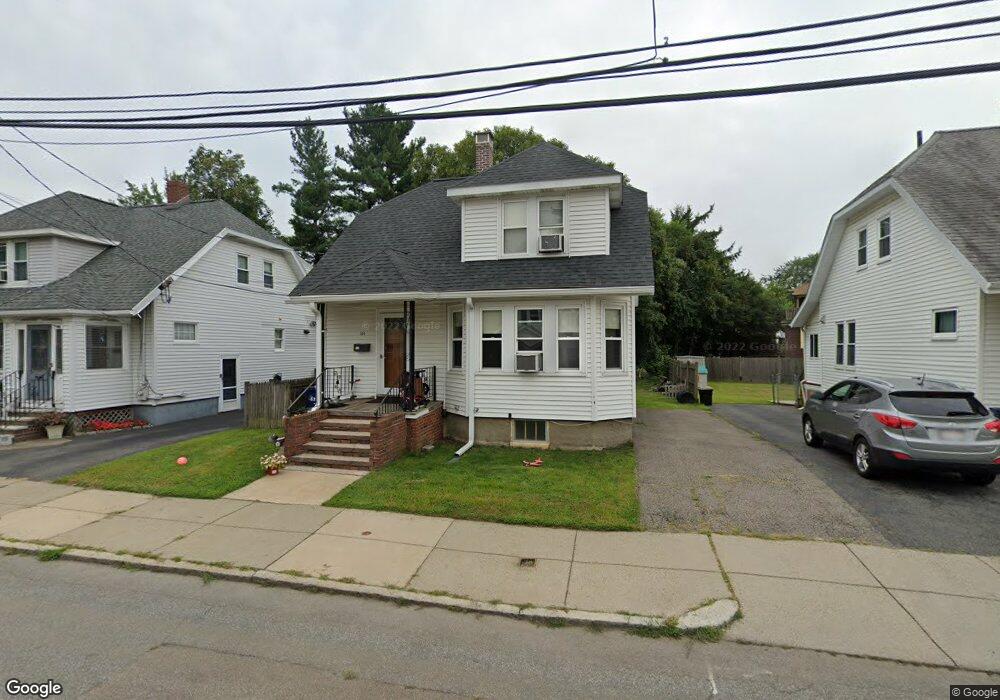
101 Goodenough St Brighton, MA 02135
Brighton NeighborhoodEstimated Value: $775,000 - $893,000
3
Beds
2
Baths
1,328
Sq Ft
$633/Sq Ft
Est. Value
About This Home
This home is located at 101 Goodenough St, Brighton, MA 02135 and is currently estimated at $840,215, approximately $632 per square foot. 101 Goodenough St is a home located in Suffolk County with nearby schools including Boston Green Academy Horace Mann Charter School, St Columbkille Partnership School, and Shaloh House Jewish Day School.
Ownership History
Date
Name
Owned For
Owner Type
Purchase Details
Closed on
Mar 5, 2018
Sold by
Feeney Patrick Est
Bought by
Feeney Patrick and Tseng Rachel M
Current Estimated Value
Home Financials for this Owner
Home Financials are based on the most recent Mortgage that was taken out on this home.
Original Mortgage
$330,000
Outstanding Balance
$280,469
Interest Rate
4.04%
Mortgage Type
New Conventional
Estimated Equity
$559,746
Purchase Details
Closed on
May 19, 2009
Sold by
Feeney Patrick and Feeney Christine
Bought by
Feeney Patrick
Create a Home Valuation Report for This Property
The Home Valuation Report is an in-depth analysis detailing your home's value as well as a comparison with similar homes in the area
Home Values in the Area
Average Home Value in this Area
Purchase History
| Date | Buyer | Sale Price | Title Company |
|---|---|---|---|
| Feeney Patrick | $625,000 | -- | |
| Feeney Patrick | -- | -- |
Source: Public Records
Mortgage History
| Date | Status | Borrower | Loan Amount |
|---|---|---|---|
| Open | Feeney Patrick | $330,000 |
Source: Public Records
Tax History Compared to Growth
Tax History
| Year | Tax Paid | Tax Assessment Tax Assessment Total Assessment is a certain percentage of the fair market value that is determined by local assessors to be the total taxable value of land and additions on the property. | Land | Improvement |
|---|---|---|---|---|
| 2025 | $7,864 | $679,100 | $258,100 | $421,000 |
| 2024 | $6,806 | $624,400 | $260,300 | $364,100 |
| 2023 | $6,511 | $606,200 | $252,700 | $353,500 |
| 2022 | $5,996 | $551,100 | $229,700 | $321,400 |
| 2021 | $5,430 | $508,900 | $216,700 | $292,200 |
| 2020 | $5,240 | $496,200 | $192,600 | $303,600 |
| 2019 | $5,029 | $477,100 | $160,500 | $316,600 |
| 2018 | $4,717 | $450,100 | $160,500 | $289,600 |
| 2017 | $4,538 | $428,500 | $160,500 | $268,000 |
| 2016 | $4,489 | $408,100 | $160,500 | $247,600 |
| 2015 | $4,558 | $376,400 | $170,000 | $206,400 |
| 2014 | $4,221 | $335,500 | $170,000 | $165,500 |
Source: Public Records
Map
Nearby Homes
- 6 Harriet St
- 11 Faneuil St
- 77 Bennett St Unit 2
- 212 Market St Unit 201
- 83-85 Surrey St
- 200-202 Market St
- 87 Etna St
- 84-86 Etna St
- 18 Glencoe St Unit 42
- 10 Waldo Terrace
- 59 Riverview Rd
- 30 Dighton St Unit 3
- 30 Dighton St
- 461 Washington St Unit 301
- 58 Dustin St Unit 1
- 71 Brooks St
- 2 Westminster Terrace
- 70 Leo Birmingham Pkwy Unit 307
- 230 Washington St Unit 6
- 230 Washington St Unit 1
- 97 Goodenough St
- 105 Goodenough St
- 93 Goodenough St
- 97 Parsons St Unit 2
- 97 Parsons St
- 91 Parsons St
- 91 Parsons St Unit 1
- 101 Parsons St
- 101 Parsons St Unit 3
- 101 Parsons St Unit 1
- 101 Parsons St Unit 2
- 89 Goodenough St
- 104 Goodenough St
- 100 Goodenough St
- 96 Goodenough St
- 92 Goodenough St
- 120-122 Leicester St
- 103 Parsons St
- 114 Leicester St
- 5 Barker St