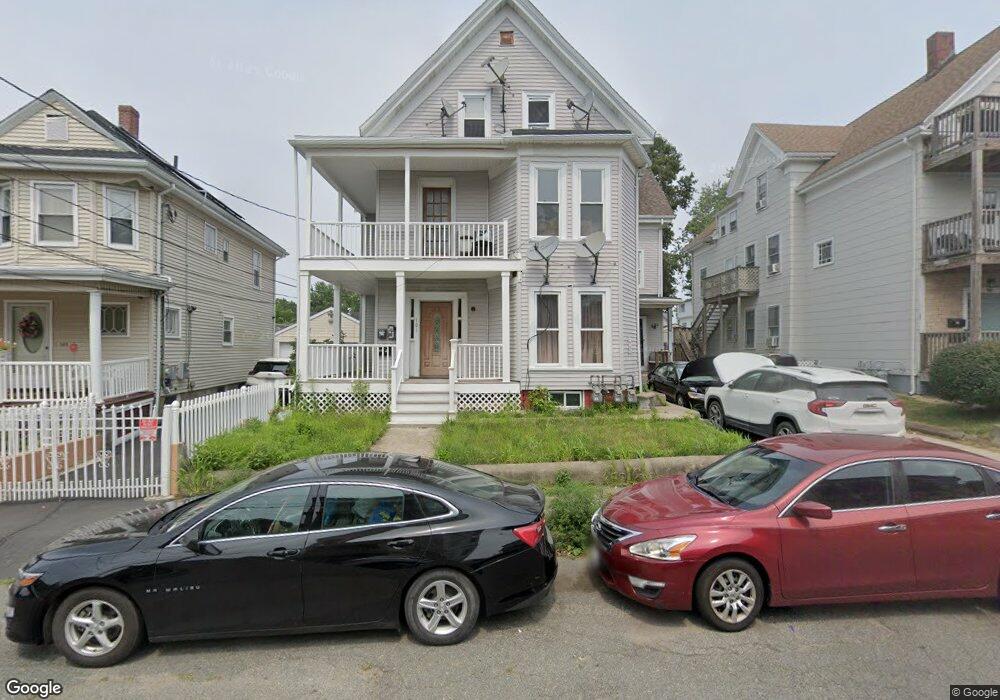
101 Harvard St Brockton, MA 02301
Clifton Heights NeighborhoodEstimated Value: $880,000 - $999,000
8
Beds
3
Baths
3,670
Sq Ft
$261/Sq Ft
Est. Value
About This Home
This home is located at 101 Harvard St, Brockton, MA 02301 and is currently estimated at $956,333, approximately $260 per square foot. 101 Harvard St is a home located in Plymouth County with nearby schools including Arnone Elementary School, Joseph F. Plouffe Middle School, and Trinity Catholic Academy.
Ownership History
Date
Name
Owned For
Owner Type
Purchase Details
Closed on
Sep 15, 1995
Sold by
Fnma
Bought by
Fontes Dina V
Current Estimated Value
Home Financials for this Owner
Home Financials are based on the most recent Mortgage that was taken out on this home.
Original Mortgage
$29,450
Interest Rate
7.81%
Mortgage Type
Purchase Money Mortgage
Purchase Details
Closed on
Jun 27, 1995
Sold by
Lopes Alvaro F and Lopes Estefania
Bought by
Federal National Mortgage Association
Purchase Details
Closed on
Dec 20, 1994
Sold by
Lopes Alvaro F and Lopes Estefania
Bought by
Federal National Mortgage Association
Purchase Details
Closed on
Jun 5, 1989
Sold by
Ronci Donald S
Bought by
Lopes Alvaro F
Home Financials for this Owner
Home Financials are based on the most recent Mortgage that was taken out on this home.
Original Mortgage
$150,000
Interest Rate
10.92%
Mortgage Type
Purchase Money Mortgage
Create a Home Valuation Report for This Property
The Home Valuation Report is an in-depth analysis detailing your home's value as well as a comparison with similar homes in the area
Home Values in the Area
Average Home Value in this Area
Purchase History
| Date | Buyer | Sale Price | Title Company |
|---|---|---|---|
| Fontes Dina V | $37,190 | -- | |
| Federal National Mortgage Association | $48,500 | -- | |
| Federal National Mortgage Association | $48,450 | -- | |
| Lopes Alvaro F | $170,000 | -- |
Source: Public Records
Mortgage History
| Date | Status | Borrower | Loan Amount |
|---|---|---|---|
| Closed | Lopes Alvaro F | $29,450 | |
| Previous Owner | Lopes Alvaro F | $150,000 |
Source: Public Records
Tax History
| Year | Tax Paid | Tax Assessment Tax Assessment Total Assessment is a certain percentage of the fair market value that is determined by local assessors to be the total taxable value of land and additions on the property. | Land | Improvement |
|---|---|---|---|---|
| 2025 | $9,044 | $746,800 | $137,300 | $609,500 |
| 2024 | $8,731 | $726,400 | $137,300 | $589,100 |
| 2023 | $8,359 | $644,000 | $102,500 | $541,500 |
| 2022 | $7,651 | $547,700 | $93,000 | $454,700 |
| 2021 | $6,860 | $473,100 | $77,000 | $396,100 |
| 2020 | $5,986 | $395,100 | $72,500 | $322,600 |
| 2019 | $5,981 | $384,900 | $70,200 | $314,700 |
| 2018 | $5,703 | $355,100 | $70,200 | $284,900 |
| 2017 | $5,519 | $342,800 | $70,200 | $272,600 |
| 2016 | $4,585 | $264,100 | $68,100 | $196,000 |
| 2015 | $3,911 | $215,500 | $68,100 | $147,400 |
| 2014 | $3,822 | $210,800 | $68,100 | $142,700 |
Source: Public Records
Map
Nearby Homes
- 97 Harvard St
- 97 Harvard St Unit 2N
- 97 Harvard St Unit 3
- 97 Harvard St Unit 2R
- 103 Harvard St
- 91 Harvard St
- 91 Harvard St Unit 2
- 111 Harvard St
- 102 Winthrop St
- 108 Winthrop St
- 98 Winthrop St
- 100 Harvard St
- 90 Harvard St
- 110 Winthrop St
- 90 Winthrop St
- 115 Harvard St
- 87 Harvard St
- 86 Winthrop St
- 114 Winthrop St
- 114 Winthrop St Unit 2
Your Personal Tour Guide
Ask me questions while you tour the home.