Estimated Value: $241,663 - $287,000
3
Beds
2
Baths
2,082
Sq Ft
$129/Sq Ft
Est. Value
About This Home
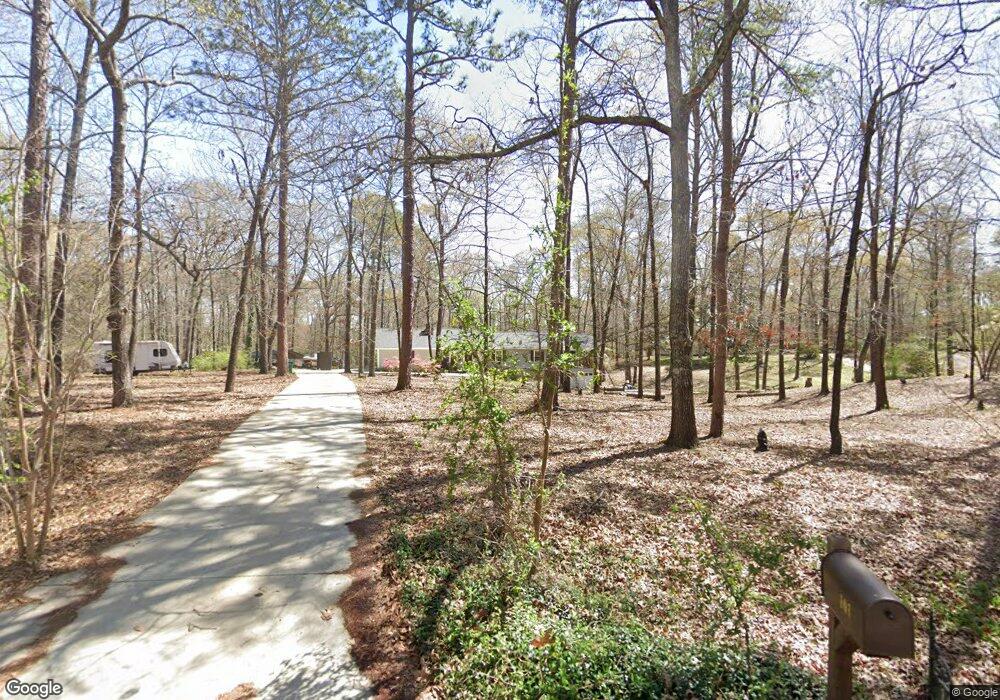
This home is located at 101 Hickory Ct, Byron, GA 31008 and is currently estimated at $269,416, approximately $129 per square foot. 101 Hickory Ct is a home located in Peach County with nearby schools including Byron Elementary School, Byron Middle School, and Peach County High School.
Ownership History
Date
Name
Owned For
Owner Type
Purchase Details
Closed on
Mar 29, 2022
Sold by
Witcher Sheldon
Bought by
Witcher Sheldon and Witcher Marie E
Current Estimated Value
Purchase Details
Closed on
Apr 21, 2016
Sold by
Garrison Katherine L
Bought by
Witcher Sheldon L
Home Financials for this Owner
Home Financials are based on the most recent Mortgage that was taken out on this home.
Original Mortgage
$139,428
Interest Rate
3.37%
Mortgage Type
FHA
Purchase Details
Closed on
Jun 10, 2013
Sold by
Garrison Debra B
Bought by
Ray Robert F
Purchase Details
Closed on
Jul 7, 1980
Bought by
Goodman Glenn A and Goodman Jacquelyn B
Purchase Details
Closed on
Jul 13, 1979
Sold by
Hammons Hammons R and Hammons Dawn L
Bought by
Goodman Glenn A
Purchase Details
Closed on
Oct 16, 1978
Sold by
Old Oak Development Inc
Bought by
Hammons Hammons R and Hammons Dawn L
Create a Home Valuation Report for This Property
The Home Valuation Report is an in-depth analysis detailing your home's value as well as a comparison with similar homes in the area
Home Values in the Area
Average Home Value in this Area
Purchase History
| Date | Buyer | Sale Price | Title Company |
|---|---|---|---|
| Witcher Sheldon | -- | -- | |
| Witcher Sheldon L | $142,000 | -- | |
| Ray Robert F | -- | -- | |
| Goodman Glenn A | -- | -- | |
| Goodman Glenn A | $48,500 | -- | |
| Hammons Hammons R | $8,300 | -- |
Source: Public Records
Mortgage History
| Date | Status | Borrower | Loan Amount |
|---|---|---|---|
| Previous Owner | Witcher Sheldon L | $139,428 |
Source: Public Records
Tax History Compared to Growth
Tax History
| Year | Tax Paid | Tax Assessment Tax Assessment Total Assessment is a certain percentage of the fair market value that is determined by local assessors to be the total taxable value of land and additions on the property. | Land | Improvement |
|---|---|---|---|---|
| 2024 | $2,005 | $67,480 | $14,720 | $52,760 |
| 2023 | $1,866 | $61,720 | $7,560 | $54,160 |
| 2022 | $1,686 | $55,040 | $7,560 | $47,480 |
| 2021 | $1,754 | $49,640 | $7,560 | $42,080 |
| 2020 | $1,869 | $53,320 | $7,560 | $45,760 |
| 2019 | $1,877 | $53,320 | $7,560 | $45,760 |
| 2018 | $1,885 | $53,320 | $7,560 | $45,760 |
| 2017 | $1,894 | $53,320 | $7,560 | $45,760 |
| 2016 | $1,823 | $53,320 | $7,560 | $45,760 |
| 2015 | -- | $53,320 | $7,560 | $45,760 |
| 2014 | $1,829 | $53,320 | $7,560 | $45,760 |
| 2013 | -- | $53,320 | $7,560 | $45,760 |
Source: Public Records
Map
Nearby Homes
- 248 Shantz Way
- 248 Shantz Way Unit (LOT A41)
- 0 Peavy Rd
- 305 Shantz Way
- The McGinnis Plan at Bryson Farms
- The Lawson Plan at Bryson Farms
- The Coleman Plan at Bryson Farms
- The Piedmont Plan at Bryson Farms
- The Harrington Plan at Bryson Farms
- 305 Shantz Way Unit (LOT C11)
- The Benson II Plan at Bryson Farms
- The Bradley Plan at Bryson Farms
- 1046 Walker Rd
- 476 Walker Rd
- 135 Abelia Ln
- 206 Christopher Dr
- 106 Christopher Dr
- 206 Cumberland Dr
- 112 Abelia Ln
- 250 Shantz Way
- 164 Old Hickory Rd
- 168 Old Hickory Rd
- 168 Red Oak Rd
- 155 Old Hickory Rd
- 109 Hickory Ct
- 164 Red Oak Rd
- 172 Red Oak Rd
- 169 Old Hickory Rd
- 172 Old Hickory Rd
- 160 Red Oak Rd
- 171 Old Hickory Rd
- 153 Old Hickory Rd
- 152 Old Hickory Rd
- 108 Old Hickory Rd
- 108 Old Hickory Rd
- 108 Dogwood Ct
- 138 Red Oak Rd
- 119 S Live Oak Ct
- 144 Red Oak Rd
- 148 Old Hickory Rd