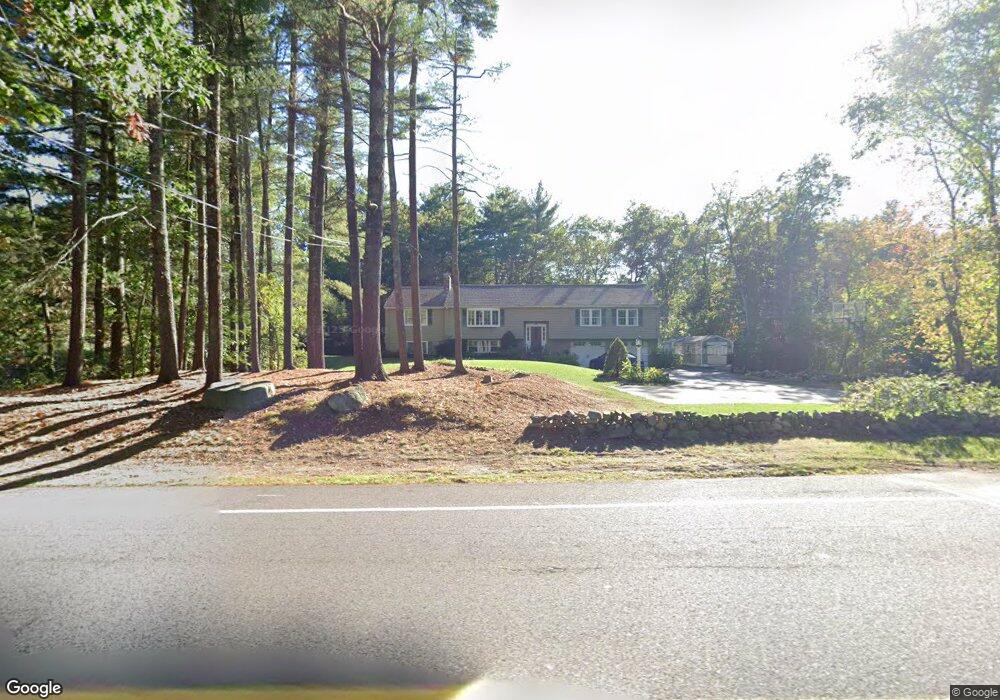
101 High St Medfield, MA 02052
Estimated Value: $907,000 - $952,000
4
Beds
3
Baths
2,280
Sq Ft
$410/Sq Ft
Est. Value
About This Home
This home is located at 101 High St, Medfield, MA 02052 and is currently estimated at $935,564, approximately $410 per square foot. 101 High St is a home located in Norfolk County with nearby schools including Ralph Wheelock School, Memorial School, and Dale Street School.
Ownership History
Date
Name
Owned For
Owner Type
Purchase Details
Closed on
Aug 10, 2006
Sold by
Gugliardo Debra L and Gugliardo Larry
Bought by
Guagliardo Ft and Gugliardo
Current Estimated Value
Create a Home Valuation Report for This Property
The Home Valuation Report is an in-depth analysis detailing your home's value as well as a comparison with similar homes in the area
Home Values in the Area
Average Home Value in this Area
Purchase History
| Date | Buyer | Sale Price | Title Company |
|---|---|---|---|
| Guagliardo Ft | -- | -- | |
| Guagliardo Ft | -- | -- |
Source: Public Records
Mortgage History
| Date | Status | Borrower | Loan Amount |
|---|---|---|---|
| Previous Owner | Guagliardo Ft | $308,750 | |
| Previous Owner | Guagliardo Ft | $189,000 | |
| Previous Owner | Guagliardo Ft | $176,000 |
Source: Public Records
Tax History Compared to Growth
Tax History
| Year | Tax Paid | Tax Assessment Tax Assessment Total Assessment is a certain percentage of the fair market value that is determined by local assessors to be the total taxable value of land and additions on the property. | Land | Improvement |
|---|---|---|---|---|
| 2025 | $10,095 | $731,500 | $386,000 | $345,500 |
| 2024 | $9,807 | $669,900 | $357,700 | $312,200 |
| 2023 | $9,618 | $623,300 | $338,900 | $284,400 |
| 2022 | $9,302 | $534,000 | $320,100 | $213,900 |
| 2021 | $8,898 | $501,000 | $310,700 | $190,300 |
| 2020 | $8,680 | $486,800 | $303,100 | $183,700 |
| 2019 | $8,369 | $468,300 | $291,800 | $176,500 |
| 2018 | $7,572 | $444,600 | $273,000 | $171,600 |
| 2017 | $7,351 | $435,200 | $263,600 | $171,600 |
| 2016 | $7,258 | $433,300 | $261,700 | $171,600 |
| 2015 | $6,815 | $424,900 | $254,200 | $170,700 |
| 2014 | $6,487 | $402,400 | $231,700 | $170,700 |
Source: Public Records
Map
Nearby Homes
- 11 Garry Dr
- 44 Millbrook Ave
- 270 South St
- 9 Lakewood Dr
- 94 Elm St
- 111 Elm St
- 16 Lee Rd
- 74 Granite St
- 12 Timberline Dr Unit 28
- 4 Lost Brook Trail
- 19 and 23 Arlington Ln
- 21 Philip St
- 195 Lincoln Rd
- 17 Bridle Path
- 15 Belknap Rd
- 14 Tiger Terrace Unit 29
- 16 Magpie Cir Unit 16
- 24 Pelican Dr
- 31 Sandtrap Cir Unit 5
- 13 Stop River Rd