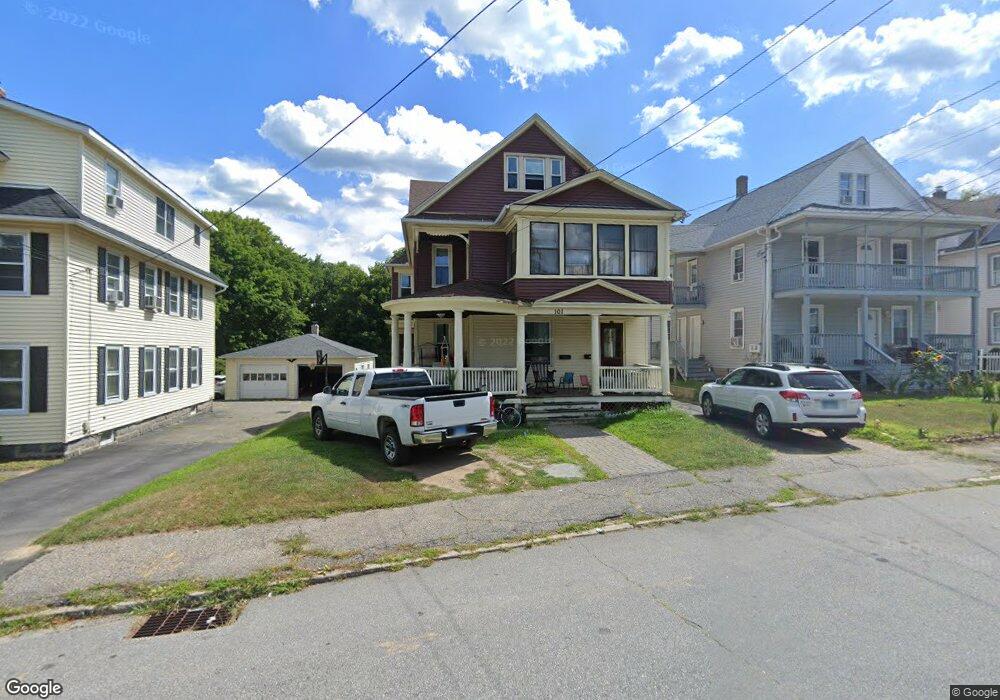
101 Hoffman St Torrington, CT 06790
Estimated Value: $253,000 - $286,000
4
Beds
2
Baths
2,476
Sq Ft
$110/Sq Ft
Est. Value
About This Home
This home is located at 101 Hoffman St, Torrington, CT 06790 and is currently estimated at $272,634, approximately $110 per square foot. 101 Hoffman St is a home located in Litchfield County with nearby schools including Torrington Middle School, Torrington High School, and St. Peter School.
Ownership History
Date
Name
Owned For
Owner Type
Purchase Details
Closed on
Aug 12, 2025
Sold by
Millord Shannon
Bought by
Koukidis Nickolaos and Koukidis Cari
Current Estimated Value
Purchase Details
Closed on
Aug 24, 2010
Sold by
Fnma
Bought by
Millord Shannon
Home Financials for this Owner
Home Financials are based on the most recent Mortgage that was taken out on this home.
Original Mortgage
$76,780
Interest Rate
4.63%
Mortgage Type
Purchase Money Mortgage
Purchase Details
Closed on
Feb 2, 2010
Sold by
Wells Fargo Bk
Bought by
Federal National Mortgage Association
Purchase Details
Closed on
Sep 18, 2006
Sold by
Rosenbeck Clarence S and Rosenbeck Robert
Bought by
Arroyo Hiram
Home Financials for this Owner
Home Financials are based on the most recent Mortgage that was taken out on this home.
Original Mortgage
$185,250
Interest Rate
6.71%
Mortgage Type
Purchase Money Mortgage
Create a Home Valuation Report for This Property
The Home Valuation Report is an in-depth analysis detailing your home's value as well as a comparison with similar homes in the area
Home Values in the Area
Average Home Value in this Area
Purchase History
| Date | Buyer | Sale Price | Title Company |
|---|---|---|---|
| Koukidis Nickolaos | $65,000 | -- | |
| Millord Shannon | $95,975 | -- | |
| Millord Shannon | $95,975 | -- | |
| Federal National Mortgage Association | -- | -- | |
| Wells Fargo Bk | -- | -- | |
| Wells Fargo Bk | -- | -- | |
| Arroyo Hiram | $195,000 | -- | |
| Arroyo Hiram | $195,000 | -- |
Source: Public Records
Mortgage History
| Date | Status | Borrower | Loan Amount |
|---|---|---|---|
| Previous Owner | Arroyo Hiram | $76,780 | |
| Previous Owner | Arroyo Hiram | $185,250 |
Source: Public Records
Tax History
| Year | Tax Paid | Tax Assessment Tax Assessment Total Assessment is a certain percentage of the fair market value that is determined by local assessors to be the total taxable value of land and additions on the property. | Land | Improvement |
|---|---|---|---|---|
| 2025 | $6,715 | $174,650 | $23,800 | $150,850 |
| 2024 | $4,965 | $103,510 | $23,760 | $79,750 |
| 2023 | $4,964 | $103,510 | $23,760 | $79,750 |
| 2022 | $4,879 | $103,510 | $23,760 | $79,750 |
| 2021 | $4,779 | $103,510 | $23,760 | $79,750 |
| 2020 | $4,611 | $99,860 | $23,760 | $76,100 |
| 2019 | $4,499 | $97,440 | $29,200 | $68,240 |
| 2018 | $4,436 | $96,080 | $29,200 | $66,880 |
| 2017 | $4,458 | $97,440 | $29,200 | $68,240 |
| 2016 | $4,396 | $96,080 | $29,200 | $66,880 |
| 2015 | $4,396 | $96,080 | $29,200 | $66,880 |
| 2014 | $4,576 | $125,990 | $40,250 | $85,740 |
Source: Public Records
Map
Nearby Homes
- 30 Culvert St
- 146 Beechwood Ave
- 116 High St
- 115 Beechwood Ave
- 64 Cooper St
- 75 Maple St
- 80 Washington Ave
- 169 Central Ave
- 329 Church St
- 95 Colorado Ave N
- 398 Funston Ave
- 00 Church St
- 68 Wilson Ave Unit 103
- 68 Wilson Ave Unit 105
- 118 Migeon Ave
- 0 Highland Ave Unit 24088105
- 42 Pulver St
- 129 Oakbrook Ln
- 264 S Main St
- 118 Pearl St
- 105 Hoffman St
- 93 Hoffman St
- 111 Hoffman St
- 5759 Washington Ave
- 85 Hoffman St
- 85 Hoffman St Unit 2F
- 85 Hoffman St 1st Flr
- 85 Hoffman St 2nd Flr
- 117 Hoffman St
- 77 Hoffman St
- 127 Hoffman St
- 114 Funston Ave
- 118 Funston Ave
- 106 Funston Ave
- 92-2 Hoffman St Unit 92 Hoffman St. 2nd F
- 92-2 Hoffman St
- 102 Funston Ave
- 108 Hoffman St
- 71 Hoffman St
- 133 Hoffman St
Your Personal Tour Guide
Ask me questions while you tour the home.