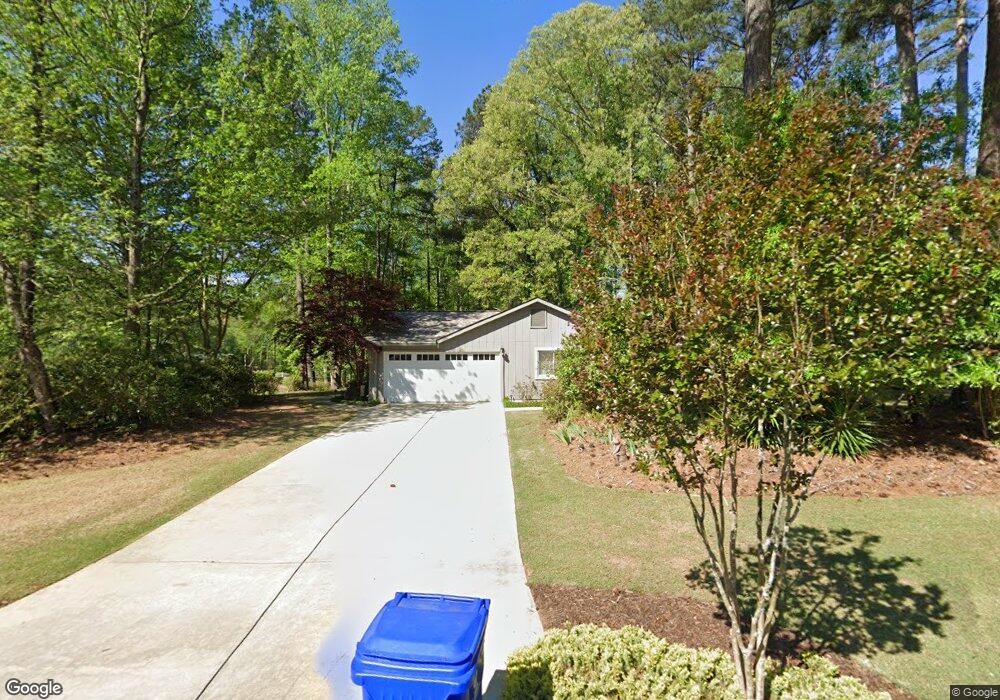
101 Journeys End Peachtree City, GA 30269
Estimated Value: $303,855 - $348,000
--
Bed
2
Baths
1,286
Sq Ft
$256/Sq Ft
Est. Value
About This Home
This home is located at 101 Journeys End, Peachtree City, GA 30269 and is currently estimated at $328,964, approximately $255 per square foot. 101 Journeys End is a home located in Fayette County with nearby schools including Huddleston Elementary School, Booth Middle School, and McIntosh High School.
Ownership History
Date
Name
Owned For
Owner Type
Purchase Details
Closed on
Dec 22, 1997
Sold by
Peevy William A and Peevy Diane E
Bought by
Messer James A
Current Estimated Value
Home Financials for this Owner
Home Financials are based on the most recent Mortgage that was taken out on this home.
Original Mortgage
$102,600
Outstanding Balance
$16,626
Interest Rate
6.75%
Mortgage Type
New Conventional
Estimated Equity
$312,338
Purchase Details
Closed on
Dec 12, 1997
Sold by
Messar James A
Bought by
Raine Susan M
Home Financials for this Owner
Home Financials are based on the most recent Mortgage that was taken out on this home.
Original Mortgage
$102,600
Outstanding Balance
$16,626
Interest Rate
6.75%
Mortgage Type
New Conventional
Estimated Equity
$312,338
Purchase Details
Closed on
May 23, 1995
Sold by
Kennedy John
Bought by
Peevy William Diane
Create a Home Valuation Report for This Property
The Home Valuation Report is an in-depth analysis detailing your home's value as well as a comparison with similar homes in the area
Home Values in the Area
Average Home Value in this Area
Purchase History
| Date | Buyer | Sale Price | Title Company |
|---|---|---|---|
| Messer James A | $86,000 | -- | |
| Raine Susan M | $108,000 | -- | |
| Peevy William Diane | $72,000 | -- |
Source: Public Records
Mortgage History
| Date | Status | Borrower | Loan Amount |
|---|---|---|---|
| Open | Raine Susan M | $102,600 | |
| Closed | Peevy William Diane | $0 |
Source: Public Records
Tax History Compared to Growth
Tax History
| Year | Tax Paid | Tax Assessment Tax Assessment Total Assessment is a certain percentage of the fair market value that is determined by local assessors to be the total taxable value of land and additions on the property. | Land | Improvement |
|---|---|---|---|---|
| 2024 | $1,305 | $131,676 | $29,200 | $102,476 |
| 2023 | $1,027 | $119,520 | $22,000 | $97,520 |
| 2022 | $1,017 | $100,880 | $22,000 | $78,880 |
| 2021 | $880 | $87,560 | $22,000 | $65,560 |
| 2020 | $844 | $80,820 | $17,100 | $63,720 |
| 2019 | $835 | $79,220 | $17,100 | $62,120 |
| 2018 | $806 | $75,340 | $17,100 | $58,240 |
| 2017 | $764 | $70,140 | $17,100 | $53,040 |
| 2016 | $691 | $58,740 | $17,100 | $41,640 |
| 2015 | $643 | $53,780 | $17,100 | $36,680 |
| 2014 | $617 | $50,100 | $17,100 | $33,000 |
| 2013 | -- | $49,260 | $0 | $0 |
Source: Public Records
Map
Nearby Homes
- 118 Whitfield Run Rd
- 404 Journeys End
- 110 Paddock Trail
- 307 Morgans Turn
- 406 Daker Dr
- 1109 Maybeck Way
- 106 Whisper Trace
- 214 Windgate Ct
- Level Three Plan at Laurel Brooke - The Enclave at Laurel Brooke
- Level Two Plan at Laurel Brooke - The Enclave at Laurel Brooke
- Level One Plan at Laurel Brooke - The Enclave at Laurel Brooke
- 940 Laurel Brooke Ave
- 527 Hazelnut Dr
- 1201 Loxley Cir
- 1000 Blair Ln
- 1000 Blair Ln Unit 302
- 930 Laurel Brooke Ave
- 1112 Montclair Dr
- 120 Fountain Head
- 1122 Montclair Dr
- 115 Doubletrace Ln Unit 14
- 115 Doubletrace Ln
- 115 Doubletrace Ln Unit 115
- 101 Gelding Garth
- 103 Gelding Garth Unit 17
- 103 Gelding Garth
- 0 Gelding Gerth Unit 7554311
- 0 Gelding Gerth Unit 7490043
- 103 Gelding Gerth Unit 17
- 201 Doubletrace Ln
- 111 Doubletrace Ln
- 102 Journeys End
- 114 Doubletrace Ln
- 105 Gelding Garth
- 116 Doubletrace Ln
- 104 Journey's End
- 118 Doubletrace Ln
- 0 Gelding Garth Unit 8643029
- 0 Gelding Garth Unit 8139359
- 0 Gelding Garth Unit 8196818