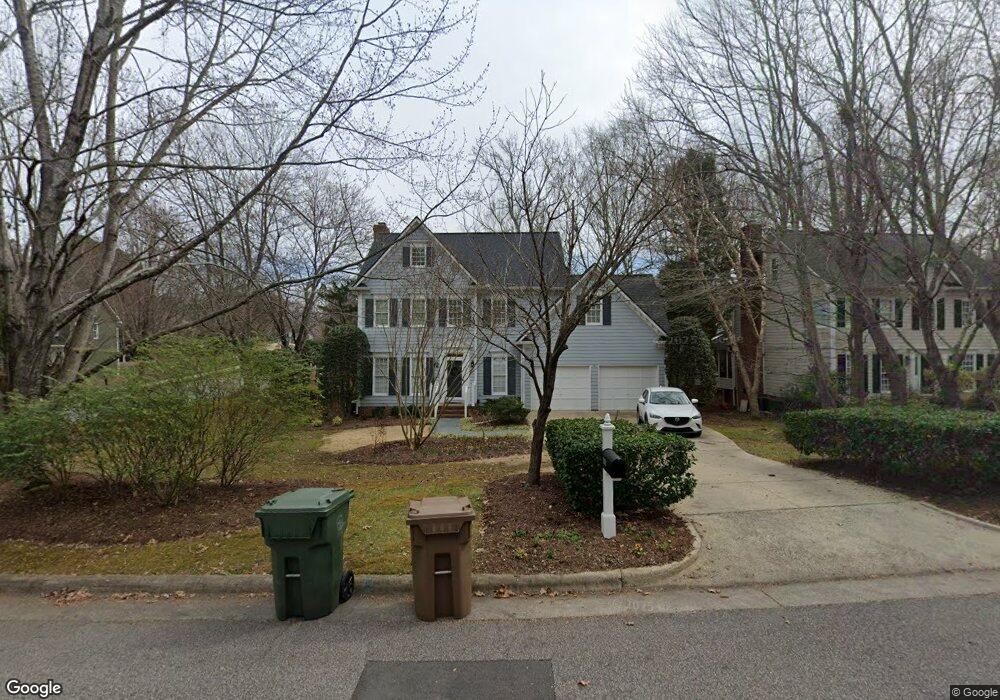
101 Langston Mill Ct Cary, NC 27518
Middle Creek NeighborhoodEstimated Value: $657,000 - $718,198
4
Beds
3
Baths
2,337
Sq Ft
$295/Sq Ft
Est. Value
About This Home
This home is located at 101 Langston Mill Ct, Cary, NC 27518 and is currently estimated at $690,300, approximately $295 per square foot. 101 Langston Mill Ct is a home located in Wake County with nearby schools including Penny Road Elementary School, Dillard Drive Magnet Middle School, and Middle Creek High.
Ownership History
Date
Name
Owned For
Owner Type
Purchase Details
Closed on
Dec 4, 2014
Sold by
Cook Michael Charles and Cook Samia
Bought by
Gurley John W and Gurley Laura N
Current Estimated Value
Home Financials for this Owner
Home Financials are based on the most recent Mortgage that was taken out on this home.
Original Mortgage
$274,500
Outstanding Balance
$208,938
Interest Rate
3.75%
Mortgage Type
Adjustable Rate Mortgage/ARM
Estimated Equity
$481,362
Purchase Details
Closed on
Sep 23, 2002
Sold by
Edwards Mark D and Edwards Stacey J
Bought by
Parvin Steven Kraig and Parvin Susan Realy
Home Financials for this Owner
Home Financials are based on the most recent Mortgage that was taken out on this home.
Original Mortgage
$202,500
Interest Rate
6.19%
Purchase Details
Closed on
May 25, 2000
Sold by
Allegretti Robert V
Bought by
Edwards Mark D and Edwards Stacey J
Home Financials for this Owner
Home Financials are based on the most recent Mortgage that was taken out on this home.
Original Mortgage
$167,000
Interest Rate
7.5%
Create a Home Valuation Report for This Property
The Home Valuation Report is an in-depth analysis detailing your home's value as well as a comparison with similar homes in the area
Home Values in the Area
Average Home Value in this Area
Purchase History
| Date | Buyer | Sale Price | Title Company |
|---|---|---|---|
| Gurley John W | $305,000 | None Available | |
| Parvin Steven Kraig | $225,000 | -- | |
| Edwards Mark D | $187,000 | -- |
Source: Public Records
Mortgage History
| Date | Status | Borrower | Loan Amount |
|---|---|---|---|
| Open | Gurley John W | $274,500 | |
| Previous Owner | Parvin Steven Kraig | $202,500 | |
| Previous Owner | Edwards Mark D | $167,000 |
Source: Public Records
Tax History Compared to Growth
Tax History
| Year | Tax Paid | Tax Assessment Tax Assessment Total Assessment is a certain percentage of the fair market value that is determined by local assessors to be the total taxable value of land and additions on the property. | Land | Improvement |
|---|---|---|---|---|
| 2025 | $5,552 | $645,467 | $200,000 | $445,467 |
| 2024 | $5,432 | $645,467 | $200,000 | $445,467 |
| 2023 | $4,591 | $456,174 | $95,000 | $361,174 |
| 2022 | $3,586 | $369,761 | $95,000 | $274,761 |
| 2021 | $3,514 | $369,761 | $95,000 | $274,761 |
| 2020 | $3,533 | $369,761 | $95,000 | $274,761 |
| 2019 | $3,403 | $315,953 | $100,000 | $215,953 |
| 2018 | $3,193 | $315,953 | $100,000 | $215,953 |
| 2017 | $3,069 | $315,953 | $100,000 | $215,953 |
| 2016 | $3,023 | $315,953 | $100,000 | $215,953 |
| 2015 | $2,886 | $291,134 | $96,000 | $195,134 |
| 2014 | $2,722 | $291,134 | $96,000 | $195,134 |
Source: Public Records
Map
Nearby Homes
- 104 Langston Mill Ct
- 313 Mount Eden Place
- 107 Sonoma Valley Dr
- 102 Forest Edge Dr
- 103 Moss Rose Ct
- 3908 Chaumont Dr
- 4104 Green Chase Way
- 401 Felspar Way
- 1413 Lily Creek Dr
- 4049 Franks Creek Dr
- 3117 Ten Rd
- 4028 Franks Creek Dr
- 612 Hawks Ridge Ct
- 10917 Bexhill Dr
- 5120 Audreystone Dr
- 108 Bittercress Ct
- 204 Oxford Mill Ct
- 4036 Chaumont Dr
- 203 Crickentree Dr
- 1108 Bradshaw Ct
- 103 Langston Mill Ct
- 100 Chapelwood Way
- 101 Felspar Way
- 105 Langston Mill Ct
- 102 Chapelwood Way
- 102 Langston Mill Ct
- 100 Langston Mill Ct
- 207 Autumngate Dr
- 104 Chapelwood Way
- 103 Felspar Way
- 205 Autumngate Dr
- 106 Chapelwood Way
- 204 Autumngate Dr
- 101 Chapelwood Way
- 301 Autumngate Dr
- 102 Craven Hill Ct
- 203 Autumngate Dr
- 105 Felspar Way
- 104 Craven Hill Ct
- 203 Langston Mill Ct