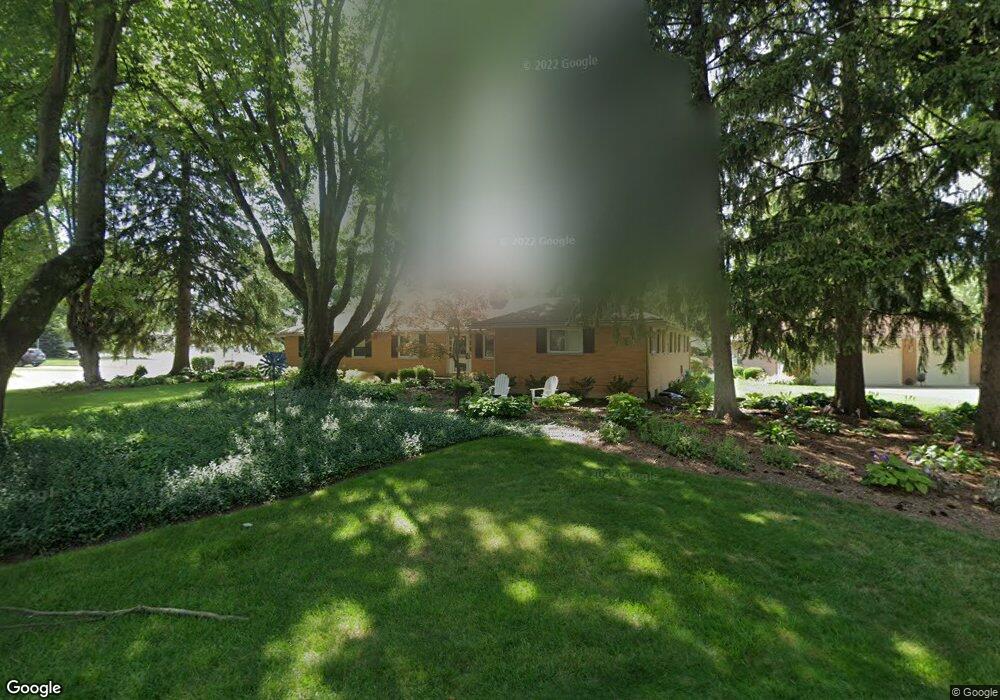
101 Laurelann Dr Dayton, OH 45429
Estimated Value: $233,000 - $352,000
3
Beds
3
Baths
1,694
Sq Ft
$189/Sq Ft
Est. Value
About This Home
This home is located at 101 Laurelann Dr, Dayton, OH 45429 and is currently estimated at $319,746, approximately $188 per square foot. 101 Laurelann Dr is a home located in Montgomery County with nearby schools including Oakview Elementary School, Van Buren Middle School, and Kettering Fairmont High School.
Ownership History
Date
Name
Owned For
Owner Type
Purchase Details
Closed on
Jun 21, 2018
Sold by
Leighty Clifford and Estate Of Paula Hawthorne
Bought by
Eberg Danny L and Eberg Gloria J
Current Estimated Value
Home Financials for this Owner
Home Financials are based on the most recent Mortgage that was taken out on this home.
Original Mortgage
$188,000
Outstanding Balance
$162,952
Interest Rate
4.6%
Mortgage Type
New Conventional
Estimated Equity
$156,794
Purchase Details
Closed on
Jun 18, 2018
Sold by
Frank Larry E and Frank Vicki L
Bought by
Elberg Danny L and Eberg Gloria L
Home Financials for this Owner
Home Financials are based on the most recent Mortgage that was taken out on this home.
Original Mortgage
$188,000
Outstanding Balance
$162,952
Interest Rate
4.6%
Mortgage Type
New Conventional
Estimated Equity
$156,794
Purchase Details
Closed on
Apr 21, 2010
Sold by
Frank Larry E
Bought by
Frank Larry E and Hawthorne Paula J
Purchase Details
Closed on
May 25, 2001
Sold by
Morrison John H and Morrison Harmie N
Bought by
Frank Larry E
Create a Home Valuation Report for This Property
The Home Valuation Report is an in-depth analysis detailing your home's value as well as a comparison with similar homes in the area
Home Values in the Area
Average Home Value in this Area
Purchase History
| Date | Buyer | Sale Price | Title Company |
|---|---|---|---|
| Eberg Danny L | $117,500 | Landmark Title Agency South | |
| Elberg Danny L | $117,500 | Landmark Title Agency South | |
| Frank Larry E | -- | Attorney | |
| Frank Larry E | $178,500 | -- |
Source: Public Records
Mortgage History
| Date | Status | Borrower | Loan Amount |
|---|---|---|---|
| Open | Eberg Danny L | $188,000 |
Source: Public Records
Tax History Compared to Growth
Tax History
| Year | Tax Paid | Tax Assessment Tax Assessment Total Assessment is a certain percentage of the fair market value that is determined by local assessors to be the total taxable value of land and additions on the property. | Land | Improvement |
|---|---|---|---|---|
| 2024 | $5,926 | $104,690 | $23,070 | $81,620 |
| 2023 | $5,926 | $104,690 | $23,070 | $81,620 |
| 2022 | $5,663 | $80,940 | $17,880 | $63,060 |
| 2021 | $5,238 | $80,940 | $17,880 | $63,060 |
| 2020 | $5,875 | $80,940 | $17,880 | $63,060 |
| 2019 | $5,809 | $70,760 | $16,250 | $54,510 |
| 2018 | $5,121 | $70,760 | $16,250 | $54,510 |
| 2017 | $4,715 | $70,760 | $16,250 | $54,510 |
| 2016 | $4,304 | $61,910 | $16,250 | $45,660 |
| 2015 | $4,111 | $61,910 | $16,250 | $45,660 |
| 2014 | $4,111 | $61,910 | $16,250 | $45,660 |
| 2012 | -- | $67,400 | $18,770 | $48,630 |
Source: Public Records
Map
Nearby Homes
- 4808 Judith Dr
- 4816 Judith Dr
- 4824 Far Hills Ave
- 101 Enid Ave
- 501 Judith Dr
- 5016 Far Hills Ave
- 617 Laurelann Dr
- 215 Colonial Ln
- 4817 Ackerman Blvd
- 5328 Landau Dr Unit 49
- 5328 Landau Dr
- 5017 Ackerman Blvd
- 4259 Maxlin Rd
- 5380 Landau Dr Unit 40
- 804 Lovetta Dr
- 5416 Landau Dr Unit 7
- 5416 Landau Dr Unit 5
- 791 Willowdale Ave
- 321 Princewood Ave
- 5095 Wheaton St
- 4739 Judith Dr
- 11 Laurelann Dr
- 4740 Far Hills Ave
- 201 Laurelann Dr
- 4740 Judith Dr
- 4731 Judith Dr
- 4732 Far Hills Ave
- 4800 Far Hills Ave
- 211 Laurelann Dr
- 4800 Judith Dr
- 4723 Judith Dr
- 4724 Far Hills Ave
- 300 Stoneybrook Dr
- 4809 Judith Dr
- 4724 Judith Dr
- 301 Laurelann Dr
- 4808 Far Hills Ave
- 107 Stoneybrook Dr
- 4716 Far Hills Ave
- 4711 Judith Dr