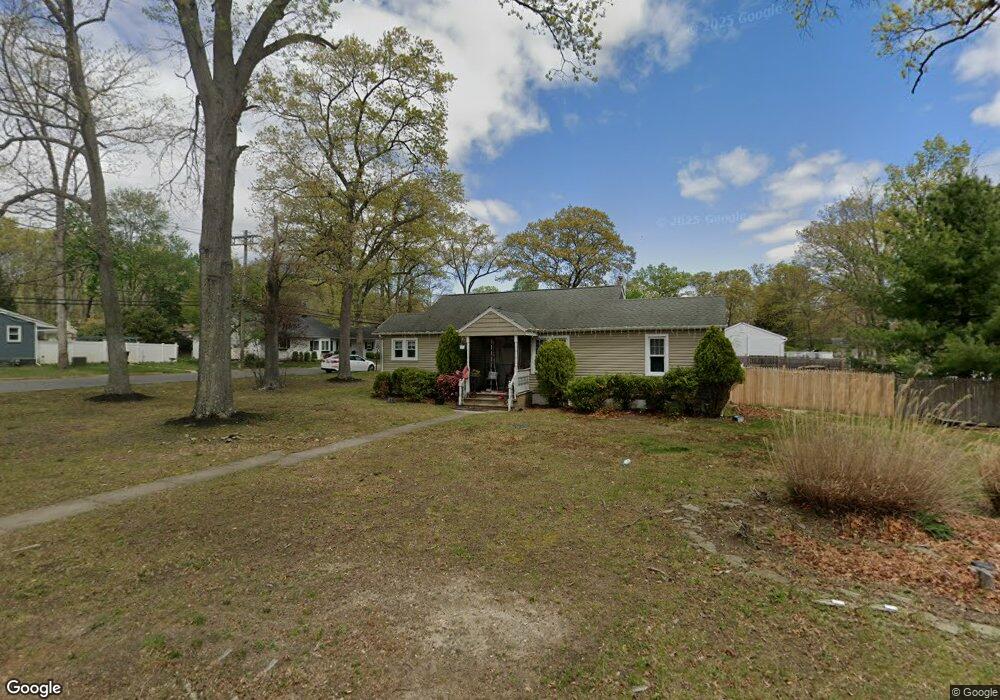
101 Locust Ave Howell, NJ 07731
Salem Hill NeighborhoodEstimated Value: $434,000 - $528,000
3
Beds
2
Baths
1,004
Sq Ft
$488/Sq Ft
Est. Value
About This Home
This home is located at 101 Locust Ave, Howell, NJ 07731 and is currently estimated at $489,622, approximately $487 per square foot. 101 Locust Ave is a home located in Monmouth County with nearby schools including Taunton School, Aldrich School, and Howell Township Middle School South.
Ownership History
Date
Name
Owned For
Owner Type
Purchase Details
Closed on
Mar 26, 2020
Sold by
Mayer Ronald
Bought by
Tram Alliance Llc
Current Estimated Value
Home Financials for this Owner
Home Financials are based on the most recent Mortgage that was taken out on this home.
Original Mortgage
$765,000
Outstanding Balance
$675,110
Interest Rate
3.2%
Mortgage Type
Commercial
Estimated Equity
-$185,488
Purchase Details
Closed on
Jul 12, 2001
Sold by
Mcbride Albert
Bought by
George Torre and Torre Maureen
Home Financials for this Owner
Home Financials are based on the most recent Mortgage that was taken out on this home.
Original Mortgage
$126,800
Interest Rate
7.2%
Purchase Details
Closed on
Jul 29, 1999
Sold by
Ruloff Barbara
Bought by
Mcbride Albert
Home Financials for this Owner
Home Financials are based on the most recent Mortgage that was taken out on this home.
Original Mortgage
$78,000
Interest Rate
7.54%
Create a Home Valuation Report for This Property
The Home Valuation Report is an in-depth analysis detailing your home's value as well as a comparison with similar homes in the area
Home Values in the Area
Average Home Value in this Area
Purchase History
| Date | Buyer | Sale Price | Title Company |
|---|---|---|---|
| Tram Alliance Llc | -- | Dekel Abstract Llc | |
| George Torre | $158,500 | -- | |
| Mcbride Albert | $128,000 | -- |
Source: Public Records
Mortgage History
| Date | Status | Borrower | Loan Amount |
|---|---|---|---|
| Open | Tram Alliance Llc | $765,000 | |
| Previous Owner | George Torre | $126,800 | |
| Previous Owner | Mcbride Albert | $78,000 |
Source: Public Records
Tax History Compared to Growth
Tax History
| Year | Tax Paid | Tax Assessment Tax Assessment Total Assessment is a certain percentage of the fair market value that is determined by local assessors to be the total taxable value of land and additions on the property. | Land | Improvement |
|---|---|---|---|---|
| 2025 | $5,345 | $363,000 | $232,800 | $130,200 |
| 2024 | $5,166 | $300,600 | $172,800 | $127,800 |
| 2023 | $5,166 | $277,600 | $152,800 | $124,800 |
| 2022 | $5,246 | $271,600 | $152,800 | $118,800 |
| 2021 | $5,246 | $228,500 | $122,800 | $105,700 |
| 2020 | $5,262 | $226,600 | $122,800 | $103,800 |
| 2019 | $5,319 | $224,800 | $122,800 | $102,000 |
| 2018 | $5,241 | $220,100 | $122,800 | $97,300 |
| 2017 | $5,228 | $217,100 | $122,800 | $94,300 |
| 2016 | $5,100 | $209,700 | $117,800 | $91,900 |
| 2015 | $4,941 | $201,100 | $111,600 | $89,500 |
| 2014 | $4,960 | $187,300 | $116,100 | $71,200 |
Source: Public Records
Map
Nearby Homes