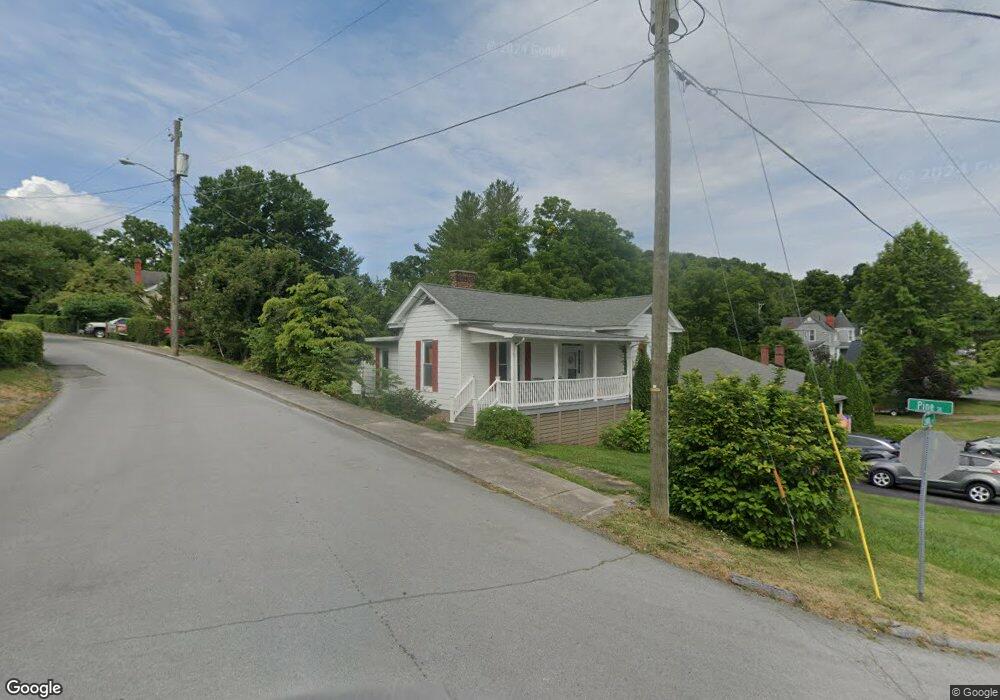
101 Lyons Ave Tazewell, VA 24651
Estimated Value: $136,000 - $158,579
3
Beds
2
Baths
1,913
Sq Ft
$77/Sq Ft
Est. Value
About This Home
This home is located at 101 Lyons Ave, Tazewell, VA 24651 and is currently estimated at $146,395, approximately $76 per square foot. 101 Lyons Ave is a home located in Tazewell County with nearby schools including Tazewell Christian Academy.
Ownership History
Date
Name
Owned For
Owner Type
Purchase Details
Closed on
Jun 28, 2021
Sold by
Stacy Briana
Bought by
Ochs Boyd Tessa Marlene
Current Estimated Value
Home Financials for this Owner
Home Financials are based on the most recent Mortgage that was taken out on this home.
Original Mortgage
$85,410
Outstanding Balance
$76,821
Interest Rate
2.9%
Mortgage Type
New Conventional
Estimated Equity
$69,574
Purchase Details
Closed on
May 24, 2018
Sold by
Leech Samuel P
Bought by
Stacy Briana
Home Financials for this Owner
Home Financials are based on the most recent Mortgage that was taken out on this home.
Original Mortgage
$88,888
Interest Rate
4.4%
Mortgage Type
New Conventional
Purchase Details
Closed on
Aug 12, 2014
Sold by
Nash Elizabeth W
Bought by
Leech Samuel P
Home Financials for this Owner
Home Financials are based on the most recent Mortgage that was taken out on this home.
Original Mortgage
$67,258
Interest Rate
3.75%
Mortgage Type
FHA
Create a Home Valuation Report for This Property
The Home Valuation Report is an in-depth analysis detailing your home's value as well as a comparison with similar homes in the area
Home Values in the Area
Average Home Value in this Area
Purchase History
| Date | Buyer | Sale Price | Title Company |
|---|---|---|---|
| Ochs Boyd Tessa Marlene | $94,900 | None Available | |
| Stacy Briana | $88,000 | None Available | |
| Leech Samuel P | $68,500 | None Available |
Source: Public Records
Mortgage History
| Date | Status | Borrower | Loan Amount |
|---|---|---|---|
| Open | Ochs Boyd Tessa Marlene | $85,410 | |
| Previous Owner | Stacy Briana | $88,888 | |
| Previous Owner | Leech Samuel P | $67,258 |
Source: Public Records
Tax History
| Year | Tax Paid | Tax Assessment Tax Assessment Total Assessment is a certain percentage of the fair market value that is determined by local assessors to be the total taxable value of land and additions on the property. | Land | Improvement |
|---|---|---|---|---|
| 2025 | $702 | $121,000 | $35,000 | $86,000 |
| 2024 | $702 | $121,000 | $35,000 | $86,000 |
| 2023 | $484 | $83,400 | $15,000 | $68,400 |
| 2022 | $484 | $83,400 | $15,000 | $68,400 |
| 2021 | $484 | $83,400 | $15,000 | $68,400 |
| 2020 | $484 | $83,400 | $15,000 | $68,400 |
| 2019 | $484 | $83,400 | $15,000 | $68,400 |
| 2018 | $527 | $83,400 | $15,000 | $68,400 |
| 2017 | $527 | $95,800 | $15,000 | $80,800 |
| 2016 | -- | $95,800 | $15,000 | $80,800 |
| 2015 | -- | $95,800 | $15,000 | $80,800 |
| 2014 | -- | $95,800 | $15,000 | $80,800 |
| 2013 | -- | $95,800 | $15,000 | $80,800 |
Source: Public Records
Map
Nearby Homes
- 133 Wausau St
- 144 Hotel Ave
- MULTIPLE 163 Surface Dr 135 Elk St 132 Brook St
- 56-A Ridgetop Ln
- Lot 56-A Ridgetop Ln
- 901 Maplewood Ln
- 135 Adams St
- 799 Dogwood Rd
- 472 Carline Ave
- 149 Stoneybrook Ln
- 219 Jeffersonville St
- TBD Deer Ridge Trail
- 1353 Fincastle Turnpike
- TBD Coopers Corner Lot 66
- 230 Barnes Ln
- 481 Hill St
- 195 Kulchar Ln
- TBD Crab Orchard Rd
- TBD Kulchar Ln
- 349 Freedom Ave
Your Personal Tour Guide
Ask me questions while you tour the home.