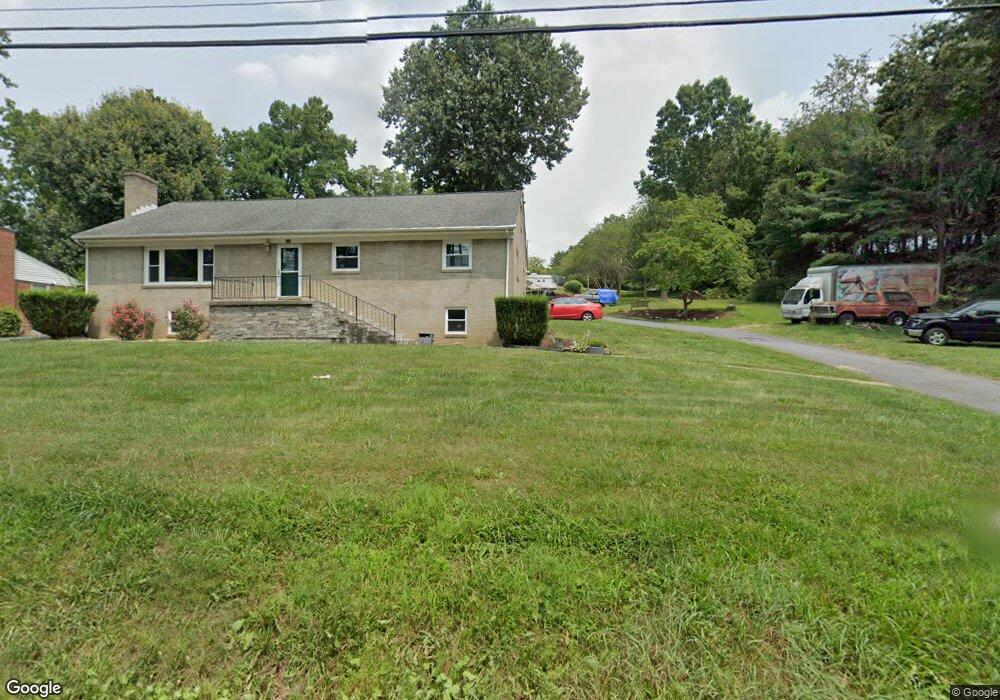
101 Morris Mill Rd Staunton, VA 24401
Estimated Value: $269,000 - $311,000
--
Bed
3
Baths
1,620
Sq Ft
$176/Sq Ft
Est. Value
About This Home
This home is located at 101 Morris Mill Rd, Staunton, VA 24401 and is currently estimated at $284,662, approximately $175 per square foot. 101 Morris Mill Rd is a home located in Staunton City with nearby schools including Ware Elementary School, Shelburne Middle School, and Staunton High School.
Ownership History
Date
Name
Owned For
Owner Type
Purchase Details
Closed on
Dec 28, 2004
Sold by
Barlow Coffey Andrea and Barlow Wiliam F
Bought by
Groxell Johnny R and Groxell Crystal L
Current Estimated Value
Home Financials for this Owner
Home Financials are based on the most recent Mortgage that was taken out on this home.
Original Mortgage
$135,700
Outstanding Balance
$65,641
Interest Rate
5.12%
Mortgage Type
New Conventional
Estimated Equity
$219,021
Create a Home Valuation Report for This Property
The Home Valuation Report is an in-depth analysis detailing your home's value as well as a comparison with similar homes in the area
Home Values in the Area
Average Home Value in this Area
Purchase History
| Date | Buyer | Sale Price | Title Company |
|---|---|---|---|
| Groxell Johnny R | -- | None Available |
Source: Public Records
Mortgage History
| Date | Status | Borrower | Loan Amount |
|---|---|---|---|
| Open | Groxell Johnny R | $135,700 |
Source: Public Records
Tax History Compared to Growth
Tax History
| Year | Tax Paid | Tax Assessment Tax Assessment Total Assessment is a certain percentage of the fair market value that is determined by local assessors to be the total taxable value of land and additions on the property. | Land | Improvement |
|---|---|---|---|---|
| 2025 | $2,380 | $261,520 | $60,020 | $201,500 |
| 2024 | $2,026 | $227,630 | $52,530 | $175,100 |
| 2023 | $2,026 | $227,630 | $52,530 | $175,100 |
| 2022 | $1,596 | $173,450 | $38,550 | $134,900 |
| 2021 | $1,596 | $173,450 | $38,550 | $134,900 |
| 2020 | $1,448 | $152,450 | $38,550 | $113,900 |
| 2019 | $1,448 | $152,450 | $38,550 | $113,900 |
| 2018 | $1,374 | $141,650 | $38,550 | $103,100 |
| 2017 | $1,374 | $141,650 | $38,550 | $103,100 |
| 2016 | $1,325 | $139,450 | $38,550 | $100,900 |
| 2015 | $1,325 | $139,450 | $38,550 | $100,900 |
| 2014 | $1,346 | $141,650 | $38,550 | $103,100 |
Source: Public Records
Map
Nearby Homes