101 N Clement St Aviston, IL 62216
Estimated Value: $276,000 - $316,668
3
Beds
3
Baths
1,578
Sq Ft
$188/Sq Ft
Est. Value
About This Home
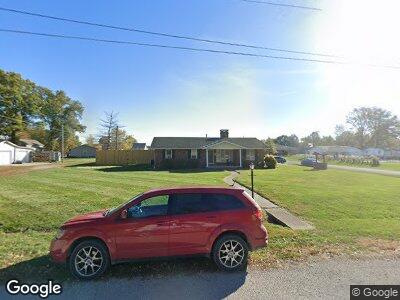
This home is located at 101 N Clement St, Aviston, IL 62216 and is currently estimated at $297,417, approximately $188 per square foot. 101 N Clement St is a home located in Clinton County with nearby schools including Aviston Elementary School, Central Community High School, and All Saints Academy.
Ownership History
Date
Name
Owned For
Owner Type
Purchase Details
Closed on
Mar 20, 2023
Sold by
Royal Living Properties Llc
Bought by
Hill Oxford Three Llc
Current Estimated Value
Purchase Details
Closed on
Jul 31, 2012
Sold by
Bahre Thomas H and Bahre Wanda J
Bought by
Royal Living Properties Llc
Home Financials for this Owner
Home Financials are based on the most recent Mortgage that was taken out on this home.
Original Mortgage
$173,500
Interest Rate
3.85%
Mortgage Type
Unknown
Create a Home Valuation Report for This Property
The Home Valuation Report is an in-depth analysis detailing your home's value as well as a comparison with similar homes in the area
Home Values in the Area
Average Home Value in this Area
Purchase History
| Date | Buyer | Sale Price | Title Company |
|---|---|---|---|
| Hill Oxford Three Llc | $885,000 | Fidelity National Title | |
| Royal Living Properties Llc | $155,000 | None Available |
Source: Public Records
Mortgage History
| Date | Status | Borrower | Loan Amount |
|---|---|---|---|
| Open | Hill Oxford Three Llc | $23,749,000 | |
| Previous Owner | Royal Living Properties Llc | $31,250 | |
| Previous Owner | Royal Living Properties Llc | $173,500 | |
| Previous Owner | Bahre Thomas H | $118,679 | |
| Previous Owner | Bahre Thomas H | $124,970 |
Source: Public Records
Tax History Compared to Growth
Tax History
| Year | Tax Paid | Tax Assessment Tax Assessment Total Assessment is a certain percentage of the fair market value that is determined by local assessors to be the total taxable value of land and additions on the property. | Land | Improvement |
|---|---|---|---|---|
| 2023 | $6,002 | $91,560 | $11,880 | $79,680 |
| 2022 | $6,002 | $72,260 | $10,730 | $61,530 |
| 2021 | $4,446 | $68,820 | $10,220 | $58,600 |
| 2020 | $4,439 | $66,180 | $9,830 | $56,350 |
| 2019 | $4,427 | $66,180 | $9,830 | $56,350 |
| 2018 | $4,269 | $61,058 | $10,091 | $50,967 |
| 2017 | $4,174 | $58,150 | $9,610 | $48,540 |
| 2016 | $4,200 | $58,150 | $9,610 | $48,540 |
| 2015 | $3,384 | $58,150 | $9,610 | $48,540 |
| 2013 | $3,384 | $58,430 | $9,610 | $48,820 |
Source: Public Records
Map
Nearby Homes