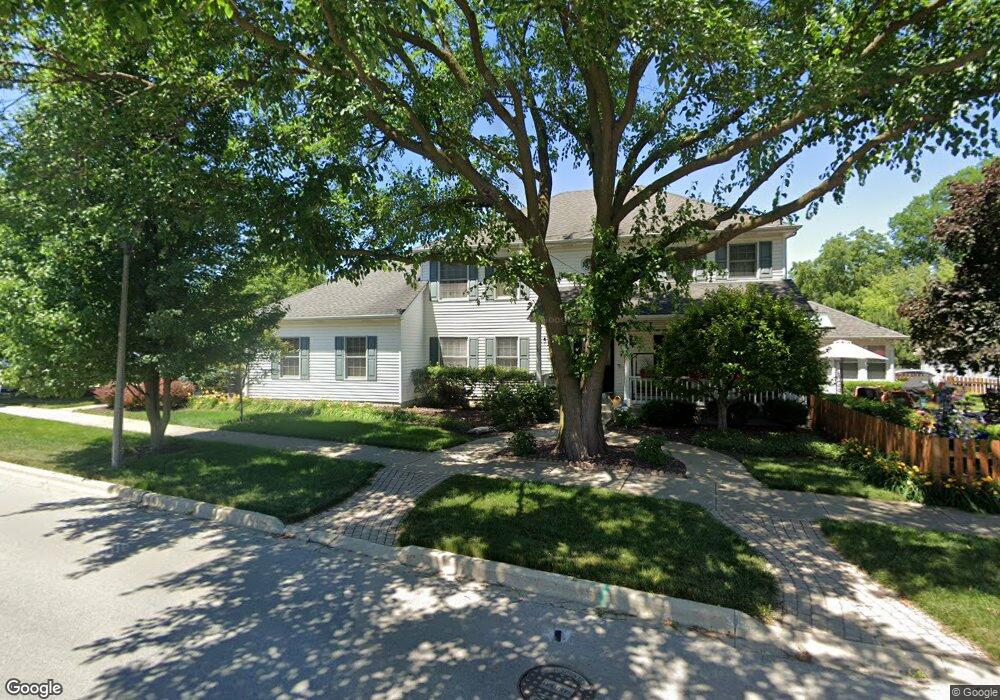
101 N Clinton Ave Elmhurst, IL 60126
Estimated Value: $1,208,348 - $1,771,000
--
Bed
--
Bath
3,097
Sq Ft
$457/Sq Ft
Est. Value
About This Home
This home is located at 101 N Clinton Ave, Elmhurst, IL 60126 and is currently estimated at $1,414,337, approximately $456 per square foot. 101 N Clinton Ave is a home located in DuPage County with nearby schools including Field Elementary School, Sandburg Middle School, and York Community High School.
Ownership History
Date
Name
Owned For
Owner Type
Purchase Details
Closed on
Mar 14, 2024
Sold by
Thomas A Lesch Living Trust and Mary A Foley Living Trust Dated
Bought by
Mary A Foley Living Trust and Foley
Current Estimated Value
Purchase Details
Closed on
May 1, 2013
Sold by
Lesch Thomas A and Foley Mary A
Bought by
Lesch Thomas A and The Thomas A Lesch Living Trust
Home Financials for this Owner
Home Financials are based on the most recent Mortgage that was taken out on this home.
Original Mortgage
$300,000
Interest Rate
3.51%
Mortgage Type
New Conventional
Purchase Details
Closed on
Apr 18, 2013
Sold by
Lesch Thomas A and Thomas A Lesch Living Trust
Bought by
Lesch Thomas A and Foley Mary A
Home Financials for this Owner
Home Financials are based on the most recent Mortgage that was taken out on this home.
Original Mortgage
$300,000
Interest Rate
3.51%
Mortgage Type
New Conventional
Purchase Details
Closed on
Dec 7, 2010
Sold by
Lesch Thomas A and Foley Mary A
Bought by
Lesch Thomas A and Foley Mary A
Purchase Details
Closed on
Aug 12, 2010
Sold by
Foley Mary A and Mary A Foley Living Trust
Bought by
Foley Mary A and Lesch Thomas A
Home Financials for this Owner
Home Financials are based on the most recent Mortgage that was taken out on this home.
Original Mortgage
$270,000
Interest Rate
4.45%
Mortgage Type
New Conventional
Purchase Details
Closed on
Mar 26, 2007
Sold by
Lesch Thomas A and Foley Mary A
Bought by
Foley Mary A and Mary A Foley Living Trust
Purchase Details
Closed on
Aug 4, 2005
Sold by
Lesch Thomas A and Thomas A Lesch Living Trust
Bought by
Lesch Thomas A and Foley Mary A
Home Financials for this Owner
Home Financials are based on the most recent Mortgage that was taken out on this home.
Original Mortgage
$316,000
Interest Rate
5.69%
Mortgage Type
Stand Alone Refi Refinance Of Original Loan
Purchase Details
Closed on
Apr 5, 2000
Sold by
Lesch Thomas A and Foley Mary A
Bought by
Lesch Thomas A and Foley Mary A
Purchase Details
Closed on
Nov 23, 1998
Sold by
T E Mckenna Inc
Bought by
Lesch Thomas A and Foley Mary A
Home Financials for this Owner
Home Financials are based on the most recent Mortgage that was taken out on this home.
Original Mortgage
$300,000
Interest Rate
7.75%
Mortgage Type
Construction
Purchase Details
Closed on
Jul 31, 1996
Sold by
American Way Development Inc
Bought by
T E Mckenna Inc
Create a Home Valuation Report for This Property
The Home Valuation Report is an in-depth analysis detailing your home's value as well as a comparison with similar homes in the area
Home Values in the Area
Average Home Value in this Area
Purchase History
| Date | Buyer | Sale Price | Title Company |
|---|---|---|---|
| Mary A Foley Living Trust | -- | None Listed On Document | |
| Lesch Thomas A | -- | None Available | |
| Lesch Thomas A | -- | None Available | |
| Lesch Thomas A | -- | None Available | |
| Foley Mary A | -- | Fidelity National Title | |
| Foley Mary A | -- | None Available | |
| Lesch Thomas A | -- | Preferred Title Insurance Ag | |
| Lesch Thomas A | -- | -- | |
| Lesch Thomas A | $125,000 | -- | |
| T E Mckenna Inc | $94,500 | -- |
Source: Public Records
Mortgage History
| Date | Status | Borrower | Loan Amount |
|---|---|---|---|
| Previous Owner | Lesch Thomas A | $300,000 | |
| Previous Owner | Foley Mary A | $270,000 | |
| Previous Owner | Lesch Thomas A | $316,000 | |
| Previous Owner | Lesch Thomas A | $300,000 |
Source: Public Records
Tax History Compared to Growth
Tax History
| Year | Tax Paid | Tax Assessment Tax Assessment Total Assessment is a certain percentage of the fair market value that is determined by local assessors to be the total taxable value of land and additions on the property. | Land | Improvement |
|---|---|---|---|---|
| 2024 | $19,557 | $340,511 | $137,089 | $203,422 |
| 2023 | $18,145 | $314,880 | $126,770 | $188,110 |
| 2022 | $15,610 | $268,430 | $121,850 | $146,580 |
| 2021 | $15,220 | $261,750 | $118,820 | $142,930 |
| 2020 | $16,396 | $285,600 | $116,220 | $169,380 |
| 2019 | $16,049 | $271,540 | $110,500 | $161,040 |
| 2018 | $16,068 | $270,370 | $104,620 | $165,750 |
| 2017 | $15,715 | $257,640 | $99,690 | $157,950 |
| 2016 | $15,381 | $242,710 | $93,910 | $148,800 |
| 2015 | $15,225 | $226,110 | $87,490 | $138,620 |
| 2014 | $14,126 | $194,310 | $70,930 | $123,380 |
| 2013 | $13,975 | $197,050 | $71,930 | $125,120 |
Source: Public Records
Map
Nearby Homes
- 134 N Caroline Ave
- 396 E Park Ave
- 130 S Elm Tree Ln
- 128 S Linden Ave
- 444 E Schiller St
- 435 E Park Ave
- 168 S Fairlane Ave
- 454 E Park Ave
- 199 S Linden Ave
- 110 N Pine St
- 402 E Huntington Ln
- 153 S Kenmore Ave
- 333 E Huntington Ln
- 240 N Willow Rd
- 145 S York St Unit 404
- 145 S York St Unit 322
- 286 N Indiana St
- 5920 Chicago Ave
- 260 E Grantley Ave
- 219 E Saint Charles Rd
- 103 N Clinton Ave
- 111 N Clinton Ave
- 375 E 1st St
- 117 N Clinton Ave
- 116 N Geneva Ave
- 121 N Clinton Ave
- 355 E 1st St
- 106 N Geneva Ave
- 110 N Clinton Ave
- 106 N Clinton Ave
- 110 N Geneva Ave
- 120 N Geneva Ave
- 124 N Geneva Ave
- 125 N Clinton Ave
- 107 S Elm Tree Ln
- 114 N Clinton Ave
- 128 N Geneva Ave
- 106 S Elm Tree Ln
- 108 S Fairlane Ave
- 129 N Clinton Ave