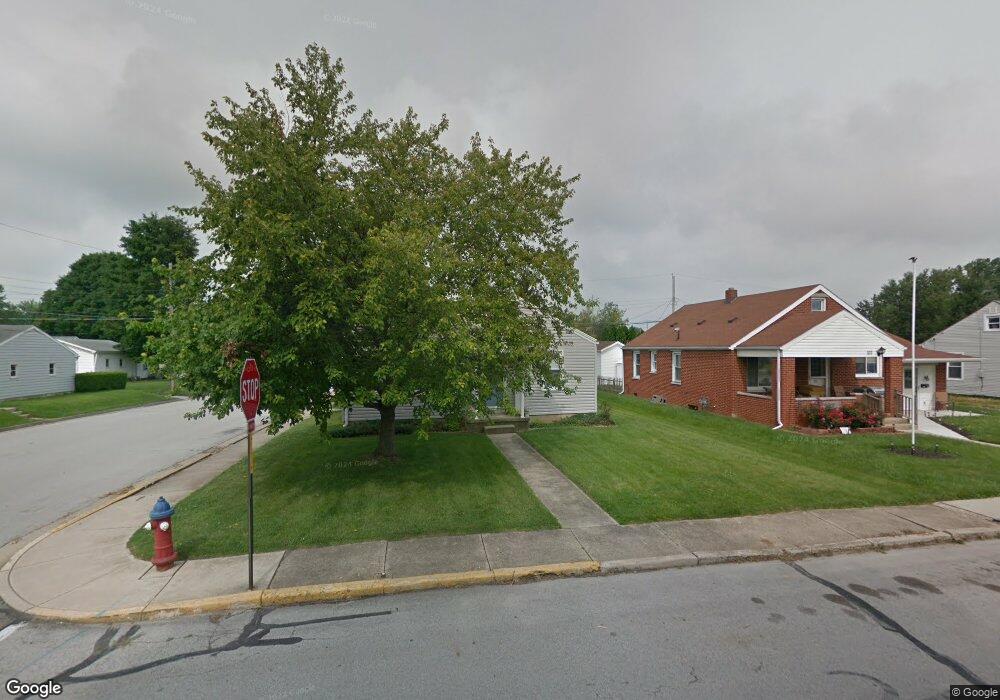
101 N Wenrick St Covington, OH 45318
Estimated Value: $164,000 - $177,706
2
Beds
1
Bath
1,106
Sq Ft
$155/Sq Ft
Est. Value
About This Home
This home is located at 101 N Wenrick St, Covington, OH 45318 and is currently estimated at $170,927, approximately $154 per square foot. 101 N Wenrick St is a home located in Miami County with nearby schools including Covington Elementary/Junior High School, Covington Junior High School, and Covington High School.
Ownership History
Date
Name
Owned For
Owner Type
Purchase Details
Closed on
Mar 31, 2004
Sold by
Besecker William Joseph and Besecker Angela Lee
Bought by
Manes Holly A
Current Estimated Value
Purchase Details
Closed on
Feb 18, 1999
Sold by
Hand Dorothy
Bought by
Besecker William Joseph and Besecker Angela Lee
Purchase Details
Closed on
Jan 1, 1990
Bought by
Hand Dorothy
Create a Home Valuation Report for This Property
The Home Valuation Report is an in-depth analysis detailing your home's value as well as a comparison with similar homes in the area
Home Values in the Area
Average Home Value in this Area
Purchase History
| Date | Buyer | Sale Price | Title Company |
|---|---|---|---|
| Manes Holly A | $99,000 | -- | |
| Besecker William Joseph | $78,000 | -- | |
| Hand Dorothy | -- | -- |
Source: Public Records
Mortgage History
| Date | Status | Borrower | Loan Amount |
|---|---|---|---|
| Closed | Besecker William Joseph | $0 |
Source: Public Records
Tax History Compared to Growth
Tax History
| Year | Tax Paid | Tax Assessment Tax Assessment Total Assessment is a certain percentage of the fair market value that is determined by local assessors to be the total taxable value of land and additions on the property. | Land | Improvement |
|---|---|---|---|---|
| 2024 | $1,765 | $47,120 | $8,930 | $38,190 |
| 2023 | $1,765 | $47,120 | $8,930 | $38,190 |
| 2022 | $1,760 | $47,120 | $8,930 | $38,190 |
| 2021 | $1,461 | $36,230 | $6,860 | $29,370 |
| 2020 | $1,465 | $36,230 | $6,860 | $29,370 |
| 2019 | $1,471 | $36,230 | $6,860 | $29,370 |
| 2018 | $1,255 | $30,840 | $5,360 | $25,480 |
| 2017 | $1,277 | $30,840 | $5,360 | $25,480 |
| 2016 | $1,261 | $30,840 | $5,360 | $25,480 |
| 2015 | $1,161 | $29,650 | $5,150 | $24,500 |
| 2014 | $1,161 | $29,650 | $5,150 | $24,500 |
| 2013 | $1,118 | $29,650 | $5,150 | $24,500 |
Source: Public Records
Map
Nearby Homes
- 271 N Ludlow St
- 698 E Broadway St
- 00 W Piqua Clay Rd
- 223 Henry Ct
- 124 N Main St
- 133 W Broadway St
- 221 S High St
- 536 S High St
- 520 N Pearl St
- 210 Charles Ct
- 212 Charles Ct
- 206 Charles Ct
- 208 Charles Ct
- 204 Charles Ct
- 207 Charles Ct
- 205 Charles Ct
- 203 Charles Ct
- 202 Charles Ct
- 201 Charles Ct
- 501 N Main St Unit C1
- 107 N Wenrick St
- 111 N Wenrick St
- 102 N Ludlow St
- 39 N Wenrick St
- 108 N Ludlow St
- 102 N Wenrick St
- 96 N Ludlow St
- 108 N Wenrick St
- 114 N Ludlow St
- 40 N Wenrick St
- 115 N Wenrick St
- 94 N Ludlow St
- 37 N Wenrick St
- 38 N Ludlow St
- 409 E Maple St
- 114 N Wenrick St
- 412 E Maple St
- 284 N Ludlow St
- 119 N Wenrick St
- 26 N Ludlow St