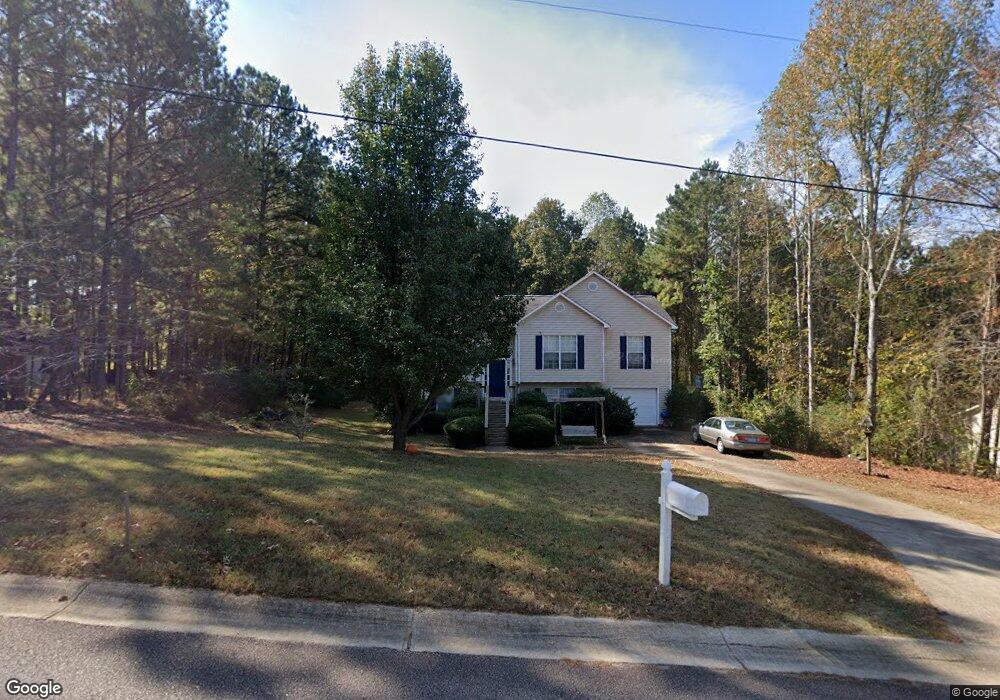
101 Northhampton Dr Lagrange, GA 30240
Estimated Value: $231,621 - $287,000
3
Beds
2
Baths
1,122
Sq Ft
$228/Sq Ft
Est. Value
About This Home
This home is located at 101 Northhampton Dr, Lagrange, GA 30240 and is currently estimated at $255,405, approximately $227 per square foot. 101 Northhampton Dr is a home located in Troup County with nearby schools including Hillcrest Elementary School, Franklin Forest Elementary School, and Hollis Hand Elementary School.
Ownership History
Date
Name
Owned For
Owner Type
Purchase Details
Closed on
Jul 24, 2001
Sold by
Dri Hampton Green Llc
Bought by
Sharman Pamela J
Current Estimated Value
Purchase Details
Closed on
Jan 20, 1999
Sold by
Dan-Ric Inc
Bought by
Dri Hampton Green Llc
Purchase Details
Closed on
Jun 25, 1997
Sold by
Ware Holland
Bought by
Dan-Ric Inc
Purchase Details
Closed on
Apr 14, 1995
Sold by
Warren J Gibson
Bought by
Ware Holland
Purchase Details
Closed on
Apr 13, 1995
Sold by
Mary Ann Bryant
Bought by
Warren J Gibson
Purchase Details
Closed on
Apr 1, 1986
Bought by
Mary Ann Bryant
Purchase Details
Closed on
Oct 1, 1982
Purchase Details
Closed on
Aug 1, 1982
Purchase Details
Closed on
Jul 8, 1982
Purchase Details
Closed on
Oct 26, 1976
Create a Home Valuation Report for This Property
The Home Valuation Report is an in-depth analysis detailing your home's value as well as a comparison with similar homes in the area
Home Values in the Area
Average Home Value in this Area
Purchase History
| Date | Buyer | Sale Price | Title Company |
|---|---|---|---|
| Sharman Pamela J | $99,800 | -- | |
| Dri Hampton Green Llc | -- | -- | |
| Dan-Ric Inc | $127,500 | -- | |
| Ware Holland | $25,000 | -- | |
| Warren J Gibson | $150,000 | -- | |
| Mary Ann Bryant | -- | -- | |
| -- | -- | -- | |
| -- | -- | -- | |
| -- | -- | -- | |
| -- | -- | -- |
Source: Public Records
Tax History Compared to Growth
Tax History
| Year | Tax Paid | Tax Assessment Tax Assessment Total Assessment is a certain percentage of the fair market value that is determined by local assessors to be the total taxable value of land and additions on the property. | Land | Improvement |
|---|---|---|---|---|
| 2024 | $2,150 | $80,840 | $10,000 | $70,840 |
| 2023 | $1,839 | $69,400 | $10,000 | $59,400 |
| 2022 | $1,823 | $67,320 | $10,000 | $57,320 |
| 2021 | $1,490 | $51,400 | $10,000 | $41,400 |
| 2020 | $1,430 | $49,400 | $8,000 | $41,400 |
| 2019 | $1,265 | $43,920 | $6,000 | $37,920 |
| 2018 | $1,265 | $43,920 | $6,000 | $37,920 |
| 2017 | $1,265 | $43,920 | $6,000 | $37,920 |
| 2016 | $1,188 | $41,381 | $4,000 | $37,381 |
| 2015 | $1,190 | $41,381 | $4,000 | $37,381 |
| 2014 | $1,133 | $39,413 | $4,000 | $35,413 |
| 2013 | -- | $43,674 | $4,000 | $39,674 |
Source: Public Records
Map
Nearby Homes
- 114 Taylor Len Dr
- 0 Wares Cross Rd Unit 20159396
- 135 Edgemont Dr Unit LOT 2
- 143 Taylor Len Dr
- 446 Hampton Green Dr
- 113 Wellington Dr
- 0 Waterview Dr Unit 10580887
- 0 Waterview Dr Unit 10558462
- 0 Waterview Dr Unit 10554814
- 0 Waterview Dr Unit LOT 34 10500921
- 0 Waterview Dr Unit LOT 37 & 27B
- 0 Waterview Dr Unit LOT 31 10491353
- 0 Waterview Dr Unit LOT 30 10491028
- 771 Waterview Dr
- 1006 Wares Cross Rd
- 219 E Yorktown Dr
- 42 Wooding Place
- 57 Hubbard Rd
- 151 Hubbard Rd
- 224 Riverbend Dr
- 103 Northhampton Dr
- 342 Wares Cross Rd
- 105 Northhampton Dr
- 100 Northhampton Dr
- 100 Northhampton Dr
- 105 N Hampton Dr
- 356 Wares Cross Rd
- 102 Northhampton Dr
- 322 Wares Cross Rd
- 322 Wares Crossroad
- 107 Northhampton Dr
- 104 Northhampton Dr
- 380 Wares Cross Rd
- N N Hampton Dr
- 109 Northhampton Dr
- 106 Northhampton Dr
- 110 Yarmouth Ct
- 351 Wares Cross Rd
- 298 Wares Cross Rd
- 112 Yarmouth Ct