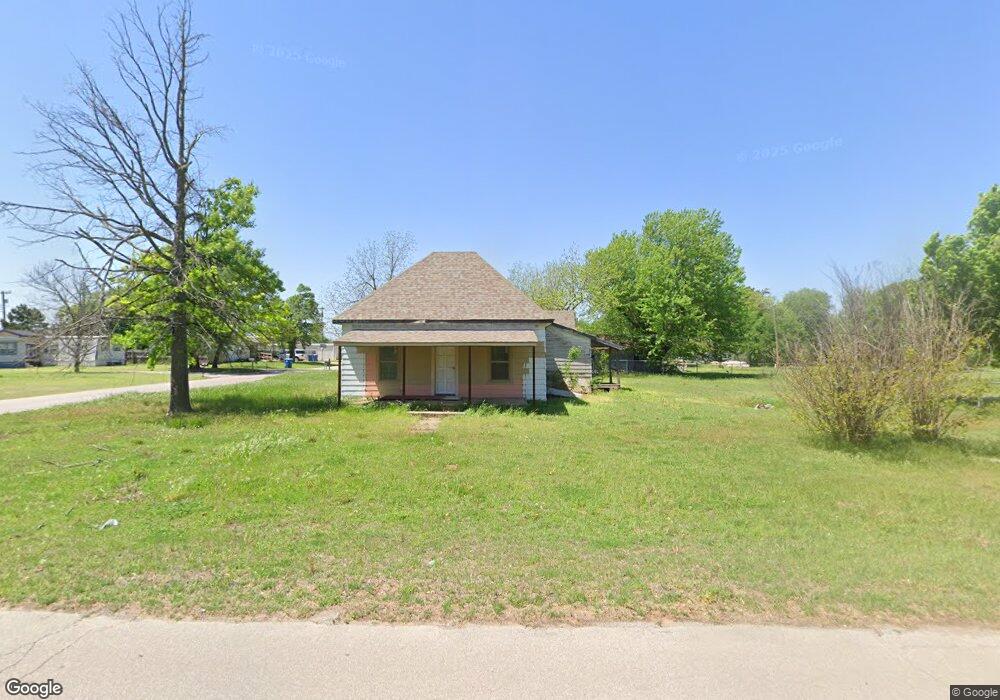
101 NW 3rd St Tuttle, OK 73089
Estimated Value: $89,000 - $210,584
3
Beds
1
Bath
1,576
Sq Ft
$103/Sq Ft
Est. Value
About This Home
This home is located at 101 NW 3rd St, Tuttle, OK 73089 and is currently estimated at $161,646, approximately $102 per square foot. 101 NW 3rd St is a home with nearby schools including Tuttle Intermediate School, Tuttle Elementary School, and Tuttle Middle School.
Ownership History
Date
Name
Owned For
Owner Type
Purchase Details
Closed on
Nov 12, 2020
Sold by
Arterberry Howard W and Arterberry Rebecca S
Bought by
Green Terry L
Current Estimated Value
Purchase Details
Closed on
Mar 30, 2017
Sold by
Traxler Donald Jack and Traxler Barbara Ann
Bought by
All Seasons Rental Propertys Llc
Home Financials for this Owner
Home Financials are based on the most recent Mortgage that was taken out on this home.
Original Mortgage
$40,000
Interest Rate
4.16%
Mortgage Type
New Conventional
Purchase Details
Closed on
Apr 7, 2014
Sold by
Vars Llc
Bought by
Asterberry Howard W and Asterberry Rebecca S
Purchase Details
Closed on
May 29, 2007
Sold by
Destiny Ventures Llc
Bought by
Vars Llc
Purchase Details
Closed on
Dec 29, 2006
Sold by
Deutsche Bank National Trust Co
Bought by
Destiny Ventures Llc
Purchase Details
Closed on
Jun 25, 2006
Sold by
Reynolds Mark A and Reynolds Virginia L
Bought by
Deutsche Bank National Trust Company
Create a Home Valuation Report for This Property
The Home Valuation Report is an in-depth analysis detailing your home's value as well as a comparison with similar homes in the area
Home Values in the Area
Average Home Value in this Area
Purchase History
| Date | Buyer | Sale Price | Title Company |
|---|---|---|---|
| Green Terry L | $57,000 | Green Kim | |
| Green Terry L | $57,000 | Green Kim | |
| All Seasons Rental Propertys Llc | $40,000 | None Available | |
| Asterberry Howard W | $15,000 | None Available | |
| Vars Llc | $4,000 | None Available | |
| Destiny Ventures Llc | $3,000 | The Oklahoma City Abstract & | |
| Deutsche Bank National Trust Company | $59,706 | None Available |
Source: Public Records
Mortgage History
| Date | Status | Borrower | Loan Amount |
|---|---|---|---|
| Previous Owner | All Seasons Rental Propertys Llc | $40,000 |
Source: Public Records
Tax History
| Year | Tax Paid | Tax Assessment Tax Assessment Total Assessment is a certain percentage of the fair market value that is determined by local assessors to be the total taxable value of land and additions on the property. | Land | Improvement |
|---|---|---|---|---|
| 2025 | $846 | $8,027 | $3,619 | $4,408 |
| 2024 | $912 | $8,027 | $3,619 | $4,408 |
| 2023 | $912 | $8,375 | $3,495 | $4,880 |
| 2022 | $876 | $7,976 | $3,579 | $4,397 |
| 2021 | $838 | $7,597 | $3,408 | $4,189 |
| 2020 | $806 | $7,235 | $3,258 | $3,977 |
| 2019 | $754 | $6,890 | $3,102 | $3,788 |
| 2018 | $679 | $6,562 | $2,958 | $3,604 |
| 2017 | $663 | $6,250 | $1,925 | $4,325 |
| 2016 | $675 | $6,250 | $1,925 | $4,325 |
| 2015 | $399 | $6,261 | $1,925 | $4,336 |
| 2014 | $399 | $3,897 | $462 | $3,435 |
Source: Public Records
Map
Nearby Homes
- 309 Elm St
- 2 NW 6th St
- 10 Westend Ct
- 1 NW 7th St
- 311 N Cimarron Rd
- 502 SW 5th St
- 104 SE 2nd St
- 605 SW 4th St
- 106 Englebretson Ln
- 901 N Cimarron Rd
- 516 Kings Ct
- 2025 E Rock Creek Rd
- 1301 E Rock Creek Rd
- 1260 E Rock Creek Rd
- 1300 Ella
- 903 County Street 2910
- 1874 E Rock Creek Rd
- 601 S Frisco Rd
- 0 Frisco Rd
- 1330 E Silver City Ridge
Your Personal Tour Guide
Ask me questions while you tour the home.