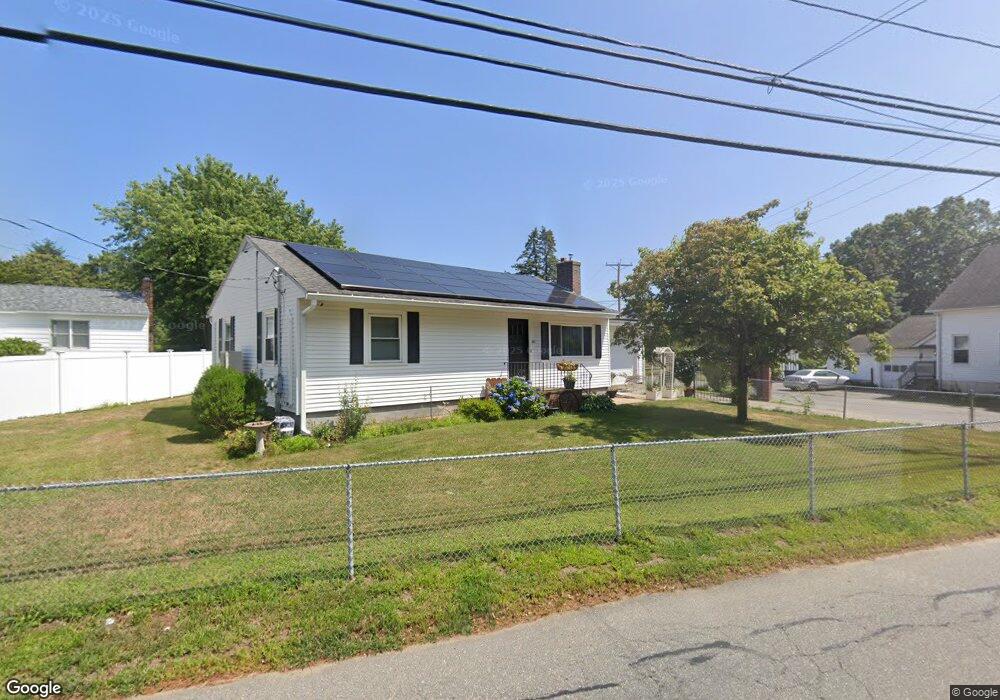
101 Oak St Methuen, MA 01844
The East End NeighborhoodEstimated Value: $583,000 - $648,000
3
Beds
2
Baths
2,394
Sq Ft
$253/Sq Ft
Est. Value
About This Home
This home is located at 101 Oak St, Methuen, MA 01844 and is currently estimated at $606,735, approximately $253 per square foot. 101 Oak St is a home located in Essex County with nearby schools including Timony Grammar School, Methuen High School, and Community Day Charter Public School - Gateway.
Ownership History
Date
Name
Owned For
Owner Type
Purchase Details
Closed on
Apr 28, 2014
Sold by
Boland Daniel and Boland Rosemarie
Bought by
Boland Daniel
Current Estimated Value
Purchase Details
Closed on
Sep 30, 1998
Sold by
Amato Rt
Bought by
Boland Daniel D
Purchase Details
Closed on
Jul 12, 1991
Sold by
Bell Mary P
Bought by
Amato Rt
Create a Home Valuation Report for This Property
The Home Valuation Report is an in-depth analysis detailing your home's value as well as a comparison with similar homes in the area
Home Values in the Area
Average Home Value in this Area
Purchase History
| Date | Buyer | Sale Price | Title Company |
|---|---|---|---|
| Boland Daniel | -- | -- | |
| Boland Daniel | -- | -- | |
| Boland Daniel D | $139,000 | -- | |
| Boland Daniel D | $139,000 | -- | |
| Amato Rt | $117,000 | -- | |
| Amato Rt | $117,000 | -- |
Source: Public Records
Mortgage History
| Date | Status | Borrower | Loan Amount |
|---|---|---|---|
| Previous Owner | Amato Rt | $196,450 | |
| Previous Owner | Amato Rt | $200,800 |
Source: Public Records
Tax History Compared to Growth
Tax History
| Year | Tax Paid | Tax Assessment Tax Assessment Total Assessment is a certain percentage of the fair market value that is determined by local assessors to be the total taxable value of land and additions on the property. | Land | Improvement |
|---|---|---|---|---|
| 2025 | $4,918 | $464,800 | $207,700 | $257,100 |
| 2024 | $4,850 | $446,600 | $189,500 | $257,100 |
| 2023 | $4,590 | $392,300 | $168,400 | $223,900 |
| 2022 | $4,404 | $337,500 | $140,300 | $197,200 |
| 2021 | $4,130 | $313,100 | $133,300 | $179,800 |
| 2020 | $4,119 | $306,500 | $133,300 | $173,200 |
| 2019 | $3,870 | $272,700 | $119,300 | $153,400 |
| 2018 | $3,779 | $264,800 | $119,300 | $145,500 |
| 2017 | $3,664 | $250,100 | $119,300 | $130,800 |
| 2016 | $3,501 | $236,400 | $112,300 | $124,100 |
Source: Public Records
Map
Nearby Homes