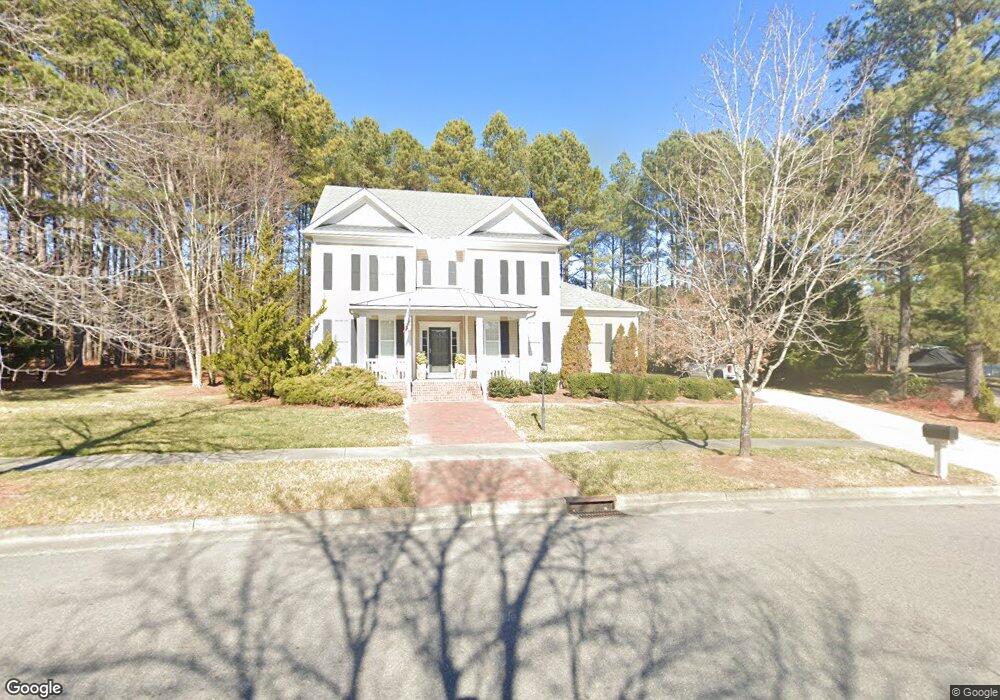
101 Oxford Park Blvd Oxford, NC 27565
Estimated Value: $513,656 - $615,000
5
Beds
3
Baths
3,000
Sq Ft
$186/Sq Ft
Est. Value
About This Home
This home is located at 101 Oxford Park Blvd, Oxford, NC 27565 and is currently estimated at $558,664, approximately $186 per square foot. 101 Oxford Park Blvd is a home located in Granville County with nearby schools including Stovall-Shaw Elementary School, Northern Granville Middle School, and Hill City High School.
Ownership History
Date
Name
Owned For
Owner Type
Purchase Details
Closed on
Sep 29, 2011
Sold by
Deal Johnny H and Deal Deborah A
Bought by
Waters Michael D and Waters Bridget B
Current Estimated Value
Home Financials for this Owner
Home Financials are based on the most recent Mortgage that was taken out on this home.
Original Mortgage
$221,876
Outstanding Balance
$152,491
Interest Rate
4.26%
Mortgage Type
New Conventional
Estimated Equity
$406,173
Purchase Details
Closed on
Apr 14, 2009
Sold by
Deal Johnny H
Bought by
Deal Johnny H and Pond Deborah Ann
Purchase Details
Closed on
Aug 7, 2008
Sold by
Park Oxford
Bought by
Deal Johnny H
Home Financials for this Owner
Home Financials are based on the most recent Mortgage that was taken out on this home.
Original Mortgage
$210,000
Interest Rate
6.43%
Mortgage Type
New Conventional
Create a Home Valuation Report for This Property
The Home Valuation Report is an in-depth analysis detailing your home's value as well as a comparison with similar homes in the area
Home Values in the Area
Average Home Value in this Area
Purchase History
| Date | Buyer | Sale Price | Title Company |
|---|---|---|---|
| Waters Michael D | $348,000 | -- | |
| Deal Johnny H | -- | -- | |
| Deal Johnny H | $300,000 | -- |
Source: Public Records
Mortgage History
| Date | Status | Borrower | Loan Amount |
|---|---|---|---|
| Open | Waters Michael D | $221,876 | |
| Previous Owner | Deal Johnny H | $210,000 |
Source: Public Records
Tax History Compared to Growth
Tax History
| Year | Tax Paid | Tax Assessment Tax Assessment Total Assessment is a certain percentage of the fair market value that is determined by local assessors to be the total taxable value of land and additions on the property. | Land | Improvement |
|---|---|---|---|---|
| 2025 | $5,880 | $505,775 | $37,000 | $468,775 |
| 2024 | $5,880 | $505,775 | $37,000 | $468,775 |
| 2023 | $4,540 | $304,327 | $25,000 | $279,327 |
| 2022 | $4,529 | $304,327 | $25,000 | $279,327 |
| 2021 | $4,524 | $304,327 | $25,000 | $279,327 |
| 2020 | $5,262 | $304,327 | $25,000 | $279,327 |
| 2019 | $5,379 | $304,327 | $25,000 | $279,327 |
| 2018 | $4,524 | $296,333 | $37,500 | $258,833 |
| 2016 | $4,583 | $300,219 | $37,500 | $262,719 |
| 2015 | $4,428 | $300,219 | $37,500 | $262,719 |
| 2014 | $4,428 | $300,219 | $37,500 | $262,719 |
| 2013 | -- | $300,219 | $37,500 | $262,719 |
Source: Public Records
Map
Nearby Homes
- 105 Byron Ct
- 3679 Oak Lawn Farm Rd
- 126 Kipling Dr
- 203 Kipling Dr
- 101 Cambridge Way
- 00 Salem Rd
- 0 Hillandale Dr
- 200 W Westbury Dr
- 715 Williamsboro St
- 103 Forest Rd
- 304 Lanier St
- 100 Maluli Dr
- 6609 Clearwater Dr
- 104 Parker St
- 505 Forest Rd
- 127 Daniel St
- 102 Royall Rd
- 611 College St
- 735 Baker St
- 722 Baker St
- 105 Oxford Park Blvd
- 200 Oxford Park Blvd
- 203 Oxford Park Blvd
- 202 Oxford Park Blvd
- 205 Oxford Park Blvd
- 204 Oxford Park Blvd
- 207 Oxford Park Blvd
- 206 Oxford Park Blvd
- 209 Oxford Park Blvd
- 100 Byron Ct
- 6062 Horner Siding Rd
- 102 Byron Ct
- 300 Oxford Park Blvd
- 104 Byron Ct
- 302 Oxford Park Blvd
- 101 Byron Ct
- 304 Oxford Park Blvd
- 106 Byron Ct
- 103 Byron Ct
- 103 Byron Ct Unit Lot15