Estimated Value: $78,829 - $189,000
--
Bed
--
Bath
1,564
Sq Ft
$92/Sq Ft
Est. Value
About This Home
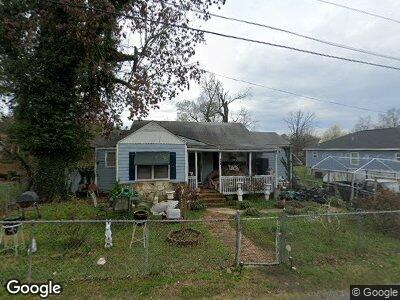
This home is located at 101 Pineway Dr SW, Rome, GA 30165 and is currently estimated at $144,207, approximately $92 per square foot. 101 Pineway Dr SW is a home located in Floyd County with nearby schools including Rome High School and St. Mary School.
Ownership History
Date
Name
Owned For
Owner Type
Purchase Details
Closed on
Mar 28, 1997
Sold by
Staton Mackey Lee and Eliz Ann
Bought by
Mims James Lindsey
Current Estimated Value
Purchase Details
Closed on
May 18, 1976
Sold by
Edgeworth Billy Ray
Bought by
Staton Mackey Lee and Eliz Ann
Purchase Details
Closed on
Jun 30, 1975
Sold by
Edgeworth Jimmy B
Bought by
Edgeworth Billy Ray
Purchase Details
Closed on
Mar 27, 1974
Sold by
Smith Ralph and Smith Alice
Bought by
Edgeworth Jimmy B
Purchase Details
Closed on
Apr 26, 1972
Sold by
Grate Joseph and Nancy Marie
Bought by
Smith Ralph and Smith Alice
Purchase Details
Closed on
Nov 12, 1971
Sold by
Bates Harold E
Bought by
Grate Joseph and Nancy Marie
Purchase Details
Closed on
Jun 18, 1966
Sold by
Thacker Charles
Bought by
Bates Harold E
Purchase Details
Closed on
Jan 1, 1901
Bought by
Thacker Charles
Create a Home Valuation Report for This Property
The Home Valuation Report is an in-depth analysis detailing your home's value as well as a comparison with similar homes in the area
Home Values in the Area
Average Home Value in this Area
Purchase History
| Date | Buyer | Sale Price | Title Company |
|---|---|---|---|
| Mims James Lindsey | $41,000 | -- | |
| Staton Mackey Lee | -- | -- | |
| Edgeworth Billy Ray | -- | -- | |
| Edgeworth Jimmy B | $1,000 | -- | |
| Smith Ralph | $1,000 | -- | |
| Grate Joseph | $14,400 | -- | |
| Bates Harold E | -- | -- | |
| Thacker Charles | -- | -- |
Source: Public Records
Mortgage History
| Date | Status | Borrower | Loan Amount |
|---|---|---|---|
| Closed | Mims James Lindsey | $48,781 |
Source: Public Records
Tax History Compared to Growth
Tax History
| Year | Tax Paid | Tax Assessment Tax Assessment Total Assessment is a certain percentage of the fair market value that is determined by local assessors to be the total taxable value of land and additions on the property. | Land | Improvement |
|---|---|---|---|---|
| 2024 | $350 | $21,233 | $9,163 | $12,070 |
| 2023 | $710 | $20,215 | $8,145 | $12,070 |
| 2022 | $688 | $18,857 | $6,787 | $12,070 |
| 2021 | $700 | $18,857 | $6,787 | $12,070 |
| 2020 | $642 | $17,160 | $5,090 | $12,070 |
| 2019 | $635 | $17,160 | $5,090 | $12,070 |
| 2018 | $635 | $17,160 | $5,090 | $12,070 |
| 2017 | $602 | $19,125 | $5,090 | $14,035 |
| 2016 | $691 | $18,600 | $5,080 | $13,520 |
| 2015 | -- | $18,600 | $5,080 | $13,520 |
| 2014 | -- | $18,600 | $5,080 | $13,520 |
Source: Public Records
Map
Nearby Homes
- 103 Wooten Dr SW
- 10 Wingfield St SW
- 20 Burnett Ferry Rd SW
- 104 Dellwood Dr NW
- 10 Leon St SW
- 0 Cedartown Rd Unit 10479932
- 0 Lexington Ln Unit 7312028
- 0 Lexington Ln Unit 10133164
- 3 Pebble Bend Ct
- 7 Texas Ave NW
- 43 Westwood Cir SW
- 107 Kirton St NW
- 2 Castlewood Dr SW
- 101 Garrard Ave NW
- 122 Payne Rd SW
- 438 Wilkerson Rd SW
- 123 Nanellen Rd SW
- 23 Westwood Cir SW
- 7 Hawk Spring Dr SW
- 101 Pineway Dr SW
- 1 Walker Dr SW
- 3 Walker Dr SW
- 100 Whitehead St SW
- 102 Whitehead St SW
- 102 Wooten Dr SW
- 0 Wooten Dr Unit 3248794
- 0 Wooten Dr
- 100 Pineway Dr SW
- 106 Whitehead St SW
- 102 Pineway Dr SW
- 5 Walker Dr SW
- 0 Pineway Dr
- 4 Walker Dr SW
- 14 Whitehead St SW
- 2 Walker Dr SW
- 108 Whitehead St SW
- 34 Whitehead St
- 2 Ken Ct SW
- 108 Pineway Dr SW