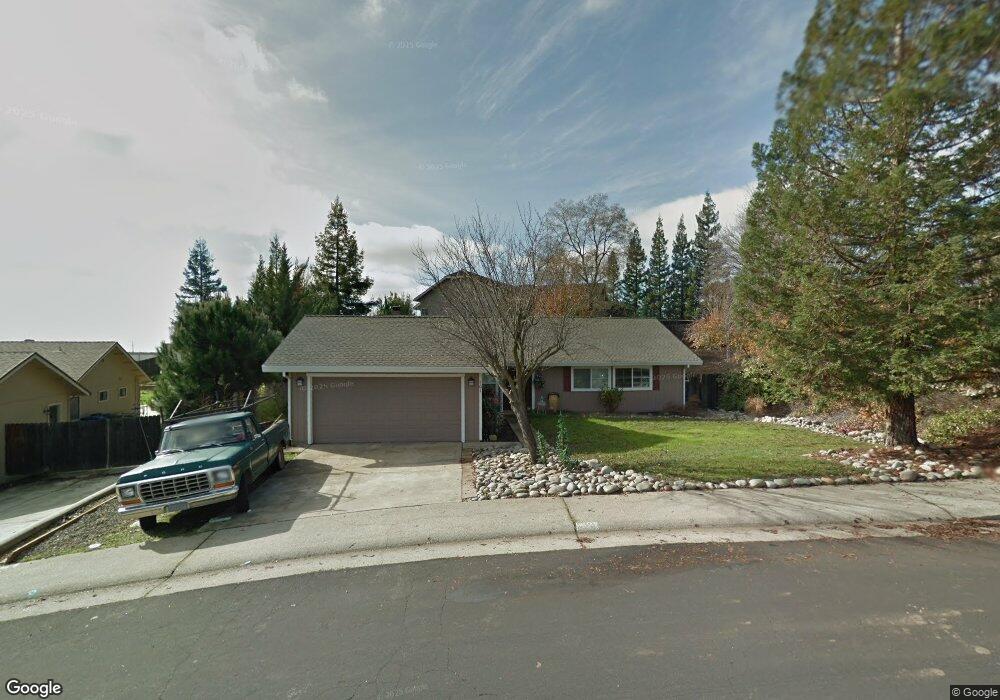
101 Remington Dr Folsom, CA 95630
Briggs Ranch NeighborhoodEstimated Value: $271,000 - $688,000
3
Beds
2
Baths
1,641
Sq Ft
$343/Sq Ft
Est. Value
About This Home
This home is located at 101 Remington Dr, Folsom, CA 95630 and is currently estimated at $563,628, approximately $343 per square foot. 101 Remington Dr is a home located in Sacramento County with nearby schools including Blanche Sprentz Elementary School, Sutter Middle School, and St. John Notre Dame School.
Ownership History
Date
Name
Owned For
Owner Type
Purchase Details
Closed on
Aug 10, 2011
Sold by
Pepper Douglas and Pepper Donna
Bought by
Pepper Douglas and Pepper Donna
Current Estimated Value
Purchase Details
Closed on
Sep 23, 2010
Sold by
Wells Fargo Bank Na
Bought by
Pepper Douglas and Pepper Donna
Home Financials for this Owner
Home Financials are based on the most recent Mortgage that was taken out on this home.
Original Mortgage
$199,200
Outstanding Balance
$130,936
Interest Rate
4.35%
Mortgage Type
Seller Take Back
Estimated Equity
$432,692
Purchase Details
Closed on
Feb 17, 2010
Sold by
Williams Roger W and Williams Toni L
Bought by
Wells Fargo Bank N A
Purchase Details
Closed on
Mar 27, 2000
Sold by
Ferguson Roy E
Bought by
Williams Roger W and Williams Toni L
Home Financials for this Owner
Home Financials are based on the most recent Mortgage that was taken out on this home.
Original Mortgage
$168,374
Interest Rate
8.38%
Mortgage Type
FHA
Purchase Details
Closed on
Dec 18, 1995
Sold by
Chapman Donald and Chapman Doreen
Bought by
Ferguson Roy E
Create a Home Valuation Report for This Property
The Home Valuation Report is an in-depth analysis detailing your home's value as well as a comparison with similar homes in the area
Home Values in the Area
Average Home Value in this Area
Purchase History
| Date | Buyer | Sale Price | Title Company |
|---|---|---|---|
| Pepper Douglas | -- | None Available | |
| Pepper Douglas | $249,000 | Old Republic Title Company | |
| Wells Fargo Bank N A | $270,000 | Accommodation | |
| Williams Roger W | $169,500 | Old Republic Title Company | |
| Ferguson Roy E | $126,000 | Fidelity National Title |
Source: Public Records
Mortgage History
| Date | Status | Borrower | Loan Amount |
|---|---|---|---|
| Open | Pepper Douglas | $199,200 | |
| Previous Owner | Williams Roger W | $168,374 |
Source: Public Records
Tax History Compared to Growth
Tax History
| Year | Tax Paid | Tax Assessment Tax Assessment Total Assessment is a certain percentage of the fair market value that is determined by local assessors to be the total taxable value of land and additions on the property. | Land | Improvement |
|---|---|---|---|---|
| 2025 | $3,408 | $318,997 | $169,107 | $149,890 |
| 2024 | $3,408 | $312,743 | $165,792 | $146,951 |
| 2023 | $3,347 | $306,612 | $162,542 | $144,070 |
| 2022 | $3,299 | $300,601 | $159,355 | $141,246 |
| 2021 | $3,255 | $294,708 | $156,231 | $138,477 |
| 2020 | $3,214 | $291,688 | $154,630 | $137,058 |
| 2019 | $3,161 | $285,970 | $151,599 | $134,371 |
| 2018 | $3,083 | $280,364 | $148,627 | $131,737 |
| 2017 | $2,875 | $274,867 | $145,713 | $129,154 |
| 2016 | $3,004 | $269,478 | $142,856 | $126,622 |
| 2015 | $2,903 | $265,432 | $140,711 | $124,721 |
| 2014 | $2,756 | $260,233 | $137,955 | $122,278 |
Source: Public Records
Map
Nearby Homes
- 109 Johnston Ct
- 260 Flower Dr
- 128 Mesquite Ct
- 237 Evelyn Way
- 164 Rebecca Way
- 103 Grenoble Way
- 124 Windstar Cir
- 102 Grenoble Way
- 124 Fargo Way
- 106 Rhoades Way
- 1118 Buckbrush Dr
- 214 Rugosa Dr
- 408-408 1/2 Reading St
- 616-616 1/2 Mormon St
- 151 Glenn Dr
- 0 Figueroa St Unit 225034113
- 166 Market St
- 1173 Boxelder Cir
- 108 Bloomfield Way
- 167 Price Way
- 103 Remington Dr
- 334 Willow Creek Dr
- 100 Echo Ct
- 105 Remington Dr
- 330 Willow Creek Dr
- 100 Remington Dr
- 400 Willow Creek Dr
- 104 Remington Dr
- 104 Echo Ct
- 107 Remington Dr
- 326 Willow Creek Dr
- 404 Willow Creek Dr
- 321 Willow Creek Dr
- 405 Willow Creek Dr
- 108 Remington Dr
- 109 Remington Dr
- 108 Echo Ct
- 322 Willow Creek Dr
- 103 Echo Ct
- 408 Willow Creek Dr