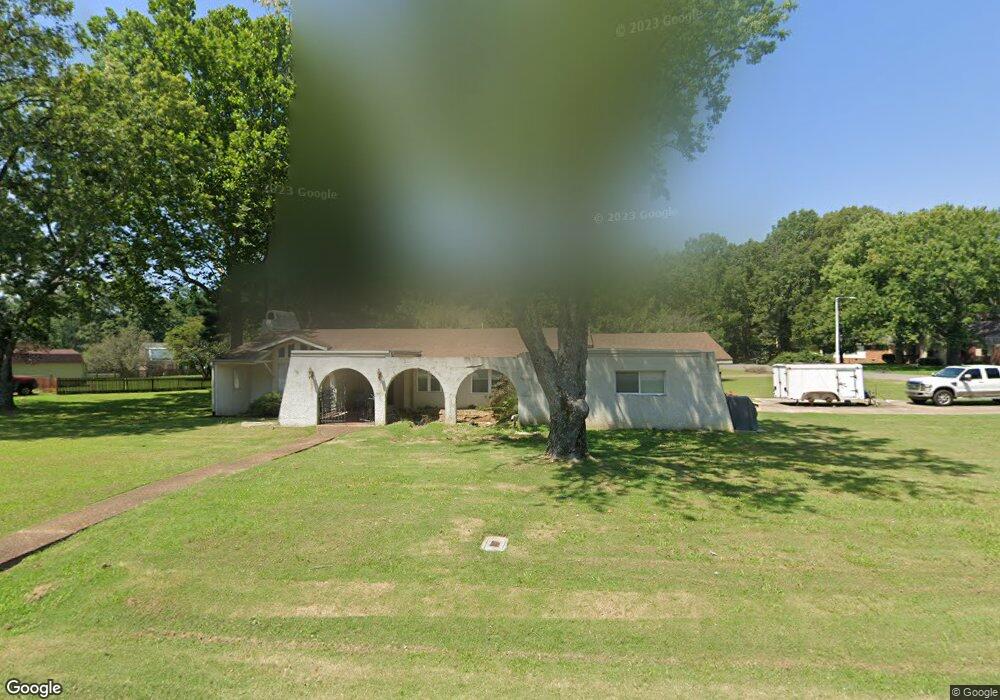
101 Rolling Hills Dr Jackson, TN 38305
Estimated Value: $178,000 - $250,000
--
Bed
3
Baths
2,262
Sq Ft
$100/Sq Ft
Est. Value
About This Home
This home is located at 101 Rolling Hills Dr, Jackson, TN 38305 and is currently estimated at $226,187, approximately $99 per square foot. 101 Rolling Hills Dr is a home located in Madison County with nearby schools including Pope School, Northeast Middle School, and North Side High School.
Ownership History
Date
Name
Owned For
Owner Type
Purchase Details
Closed on
Mar 23, 2023
Sold by
Matlock William Kevin
Bought by
Matlock William Kevin and Bryson Ashley Nicole
Current Estimated Value
Purchase Details
Closed on
Jul 29, 2009
Sold by
Miller William S
Bought by
Matlock William Kevin
Purchase Details
Closed on
Apr 9, 2009
Sold by
Bell Eric
Bought by
Miller William S
Purchase Details
Closed on
Sep 23, 2002
Sold by
Haltom Ed
Bought by
Bell Eric
Purchase Details
Closed on
Jul 15, 2002
Sold by
Woods Jonathan
Bought by
Haltom Ed
Purchase Details
Closed on
May 30, 2002
Sold by
Kirsch Joe M Sub Tr
Bought by
Chase Manhattan Bank
Purchase Details
Closed on
Apr 1, 2002
Bought by
Chase Manhattan Bk
Purchase Details
Closed on
Dec 12, 2000
Sold by
Swaidner Stephen E
Bought by
Swaidner Nita H
Purchase Details
Closed on
Jul 31, 1996
Sold by
Gray Gary James
Bought by
Swaidner Stephen and Swaidner Nita
Purchase Details
Closed on
Mar 5, 1993
Bought by
Gray Gary James
Purchase Details
Closed on
Jun 24, 1985
Bought by
Gray Gary J
Create a Home Valuation Report for This Property
The Home Valuation Report is an in-depth analysis detailing your home's value as well as a comparison with similar homes in the area
Home Values in the Area
Average Home Value in this Area
Purchase History
| Date | Buyer | Sale Price | Title Company |
|---|---|---|---|
| Matlock William Kevin | -- | -- | |
| Matlock William Kevin | $84,500 | -- | |
| Miller William S | $75,000 | -- | |
| Bell Eric | $128,000 | -- | |
| Haltom Ed | -- | -- | |
| Chase Manhattan Bank | $91,327 | -- | |
| Chase Manhattan Bk | $91,300 | -- | |
| Swaidner Nita H | -- | -- | |
| Swaidner Stephen | $93,000 | -- | |
| Gray Gary James | -- | -- | |
| Gray Gary J | -- | -- |
Source: Public Records
Tax History Compared to Growth
Tax History
| Year | Tax Paid | Tax Assessment Tax Assessment Total Assessment is a certain percentage of the fair market value that is determined by local assessors to be the total taxable value of land and additions on the property. | Land | Improvement |
|---|---|---|---|---|
| 2024 | $960 | $51,225 | $6,250 | $44,975 |
| 2022 | $1,785 | $51,225 | $6,250 | $44,975 |
| 2021 | $1,070 | $24,825 | $5,000 | $19,825 |
| 2020 | $1,070 | $24,825 | $5,000 | $19,825 |
| 2019 | $1,070 | $24,825 | $5,000 | $19,825 |
| 2018 | $1,070 | $24,825 | $5,000 | $19,825 |
| 2017 | $1,099 | $24,900 | $5,000 | $19,900 |
| 2016 | $1,024 | $24,900 | $5,000 | $19,900 |
| 2015 | $1,024 | $24,900 | $5,000 | $19,900 |
| 2014 | $1,080 | $26,275 | $5,000 | $21,275 |
Source: Public Records
Map
Nearby Homes
- 0 Hwy 412 E
- 281 Pipkin Rd
- 7 Northwind Dr
- 9 Windwood Dr
- 218 Old Bells Rd
- 4 Windwood Dr
- 1003 Country Club Ln
- 56 Claiborne Dr
- 0 Hwy 412 W Unit 24506932
- 117 Tuckahoe Rd
- 35 Eaglecrest
- 54 Forest Downs Dr
- 26 Tall Pines
- 35 Hampstead Cove
- 26 Bridlepath Dr
- 00 Interstate 40
- 100 Crest Ridge Dr
- 388 Wellington Cove
- 812 Pipkin Rd
- 221 Flagstone Dr
- 18 Hemlock Cove
- 85 Rolling Hills Dr
- 106 Rolling Hills Dr
- 96 Rolling Hills Dr
- 5 Hemlock Cove
- 116 Rolling Hills Dr
- 15 Hemlock Cove
- 77 Rolling Hills Dr
- 86 Rolling Hills Dr
- 126 Rolling Hills Dr
- 33 Hemlock Cove
- 72 Rolling Hills Dr
- 149 Rolling Hills Dr
- 27 Dogwood Dr
- 35 Hemlock Cove
- 11 Dogwood Dr
- 31 Dogwood Dr
- 60 Rolling Hills Dr
- 140 Rolling Hills Dr
- 165 Rolling Hills Dr