Estimated Value: $147,000 - $228,768
4
Beds
2
Baths
2,536
Sq Ft
$74/Sq Ft
Est. Value
About This Home
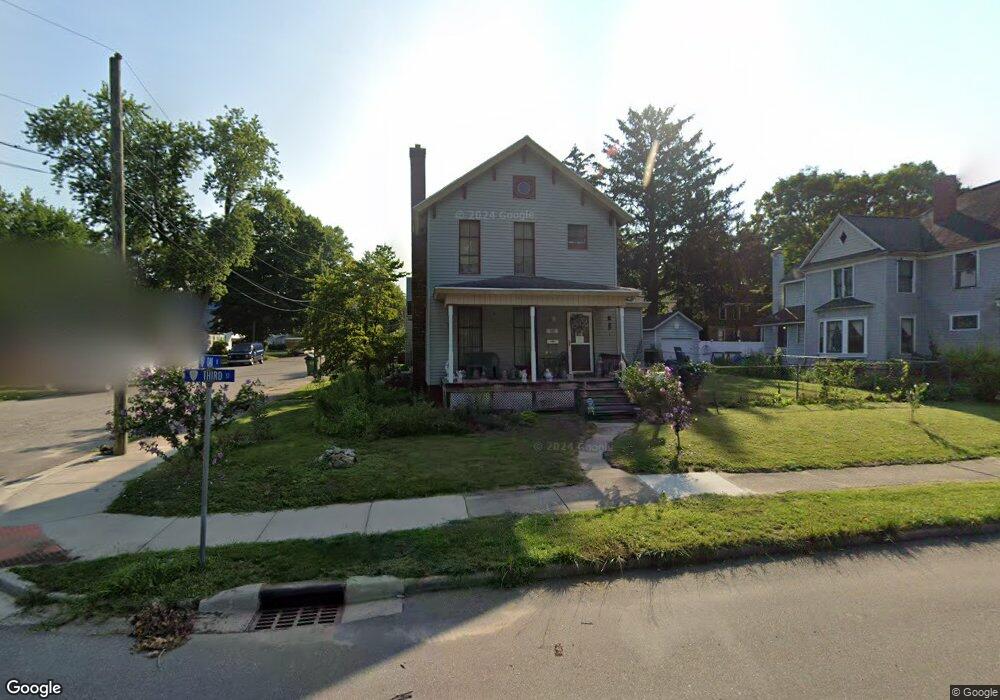
This home is located at 101 S 3rd St, Niles, MI 49120 and is currently estimated at $187,192, approximately $73 per square foot. 101 S 3rd St is a home located in Berrien County with nearby schools including Ballard Elementary School, Oak Manor Sixth Grade Center, and Ring Lardner Middle School.
Ownership History
Date
Name
Owned For
Owner Type
Purchase Details
Closed on
Sep 19, 2024
Sold by
Simpson Deborah J
Bought by
Simpson Deborah J and Simpson Larry Michael
Current Estimated Value
Purchase Details
Closed on
Jul 10, 1997
Purchase Details
Closed on
May 14, 1996
Purchase Details
Closed on
Oct 27, 1993
Purchase Details
Closed on
Jan 9, 1986
Purchase Details
Closed on
Nov 13, 1985
Purchase Details
Closed on
Jun 9, 1980
Create a Home Valuation Report for This Property
The Home Valuation Report is an in-depth analysis detailing your home's value as well as a comparison with similar homes in the area
Home Values in the Area
Average Home Value in this Area
Purchase History
| Date | Buyer | Sale Price | Title Company |
|---|---|---|---|
| Simpson Deborah J | -- | None Listed On Document | |
| -- | $36,000 | -- | |
| -- | $100 | -- | |
| -- | $100 | -- | |
| -- | $36,000 | -- | |
| -- | $100 | -- | |
| -- | $100 | -- | |
| -- | $22,000 | -- |
Source: Public Records
Tax History
| Year | Tax Paid | Tax Assessment Tax Assessment Total Assessment is a certain percentage of the fair market value that is determined by local assessors to be the total taxable value of land and additions on the property. | Land | Improvement |
|---|---|---|---|---|
| 2025 | $1,472 | $99,400 | $0 | $0 |
| 2024 | $1,156 | $92,100 | $0 | $0 |
| 2023 | $1,108 | $70,700 | $0 | $0 |
| 2022 | $1,055 | $66,000 | $0 | $0 |
| 2021 | $1,295 | $61,600 | $4,100 | $57,500 |
| 2020 | $1,281 | $47,600 | $0 | $0 |
| 2019 | $1,265 | $43,600 | $11,200 | $32,400 |
| 2018 | $1,223 | $43,600 | $0 | $0 |
| 2017 | $1,203 | $37,100 | $0 | $0 |
| 2016 | $1,177 | $34,700 | $0 | $0 |
| 2015 | $1,174 | $31,900 | $0 | $0 |
| 2014 | $916 | $31,800 | $0 | $0 |
Source: Public Records
Map
Nearby Homes
Your Personal Tour Guide
Ask me questions while you tour the home.