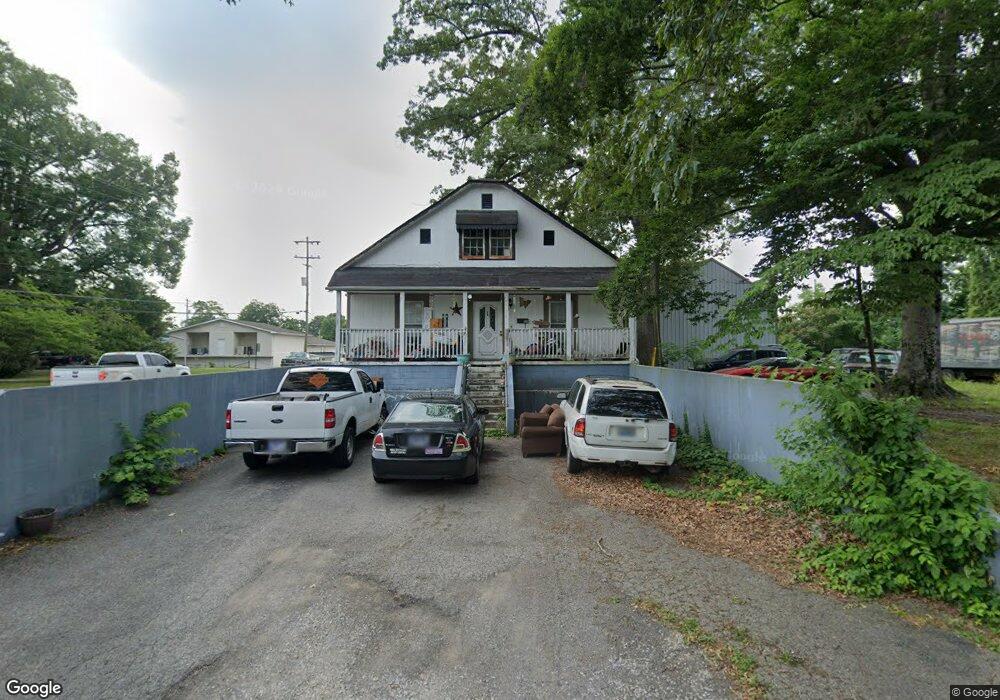
101 S Baker St Oneida, TN 37841
Estimated Value: $149,438 - $247,000
4
Beds
2
Baths
2,208
Sq Ft
$90/Sq Ft
Est. Value
About This Home
This home is located at 101 S Baker St, Oneida, TN 37841 and is currently estimated at $198,110, approximately $89 per square foot. 101 S Baker St is a home located in Scott County with nearby schools including Oneida Elementary School, Oneida Middle School, and Oneida High School.
Ownership History
Date
Name
Owned For
Owner Type
Purchase Details
Closed on
Jun 16, 2011
Sold by
Primitive Properties Llc &
Bought by
Carson Hollin and Carson Amy
Current Estimated Value
Purchase Details
Closed on
Jun 29, 2007
Sold by
Steven Bell
Bought by
Primitive Properties Llc &
Home Financials for this Owner
Home Financials are based on the most recent Mortgage that was taken out on this home.
Original Mortgage
$52,469
Interest Rate
6.35%
Mortgage Type
Cash
Purchase Details
Closed on
Dec 10, 2003
Bought by
Bell Steven
Purchase Details
Closed on
Feb 20, 2002
Bought by
Perry Larry E
Purchase Details
Closed on
Feb 5, 2001
Bought by
Union Planters Bank Nat As
Purchase Details
Closed on
Sep 5, 1997
Bought by
Murley Gary L
Purchase Details
Closed on
Aug 27, 1993
Bought by
Perry Larry M D
Purchase Details
Closed on
Feb 26, 1992
Bought by
Brewster Builders
Purchase Details
Closed on
Nov 14, 1991
Bought by
Burk Millie E
Create a Home Valuation Report for This Property
The Home Valuation Report is an in-depth analysis detailing your home's value as well as a comparison with similar homes in the area
Home Values in the Area
Average Home Value in this Area
Purchase History
| Date | Buyer | Sale Price | Title Company |
|---|---|---|---|
| Carson Hollin | $60,000 | -- | |
| Primitive Properties Llc & | -- | -- | |
| Bell Steven | $50,000 | -- | |
| Perry Larry E | $42,500 | -- | |
| Union Planters Bank Nat As | $60,000 | -- | |
| Murley Gary L | -- | -- | |
| Perry Larry M D | -- | -- | |
| Brewster Builders | -- | -- | |
| -- | -- | -- | |
| Burk Millie E | -- | -- |
Source: Public Records
Mortgage History
| Date | Status | Borrower | Loan Amount |
|---|---|---|---|
| Previous Owner | Burk Millie E | $52,469 |
Source: Public Records
Tax History
| Year | Tax Paid | Tax Assessment Tax Assessment Total Assessment is a certain percentage of the fair market value that is determined by local assessors to be the total taxable value of land and additions on the property. | Land | Improvement |
|---|---|---|---|---|
| 2025 | $853 | $27,300 | $2,000 | $25,300 |
| 2024 | $853 | $27,300 | $2,000 | $25,300 |
| 2023 | $877 | $27,300 | $2,000 | $25,300 |
| 2022 | $733 | $16,475 | $2,000 | $14,475 |
| 2021 | $624 | $16,475 | $2,000 | $14,475 |
| 2020 | $486 | $16,475 | $2,000 | $14,475 |
| 2019 | $656 | $16,475 | $2,000 | $14,475 |
| 2018 | $656 | $16,475 | $2,000 | $14,475 |
| 2017 | $695 | $17,450 | $1,750 | $15,700 |
| 2016 | $680 | $17,450 | $1,750 | $15,700 |
| 2015 | $659 | $17,450 | $1,750 | $15,700 |
| 2014 | $659 | $17,450 | $1,750 | $15,700 |
Source: Public Records
Map
Nearby Homes
- 108 W 1st Ave
- 18741 Alberta St
- 0 Marlow St Unit 1321095
- Tbd Grave Hill Rd
- 216 Lafayette St
- 342 Vine Ave
- 202 Chester St
- 458 Slaven Ln
- 191 Ashley Ln
- 19421 Alberta St
- 35 Buffalo Rd
- 942 W 3rd Ave
- 120 Wright St
- 121 Sexton Ln
- 590 Litton Rd
- 226 Keeton Ln
- 201 Grand Pappy Ln
- 0 Eli Ln
- 5821 Buffalo Rd
- 135 Harold Brooks Ln
- 103 S Baker St
- 107 S Baker St
- 148 W 3rd Ave
- 100 S Baker St
- 18641 Alberta St
- 104 S Baker St
- 18577 Alberta St Unit ST213
- 206 W 2nd Ave
- 135 W 4th Ave
- 225 W 3rd Ave
- 18679 Alberta St
- 119 S Carson St
- 167 W 4th Ave
- 230 W 2nd Ave
- 220 W 3rd Ave
- 250 W 2nd Ave
- 200 S Baker St
- 203 W 4th Ave
- 18694 Alberta St
- 134 W 4th Ave
Your Personal Tour Guide
Ask me questions while you tour the home.