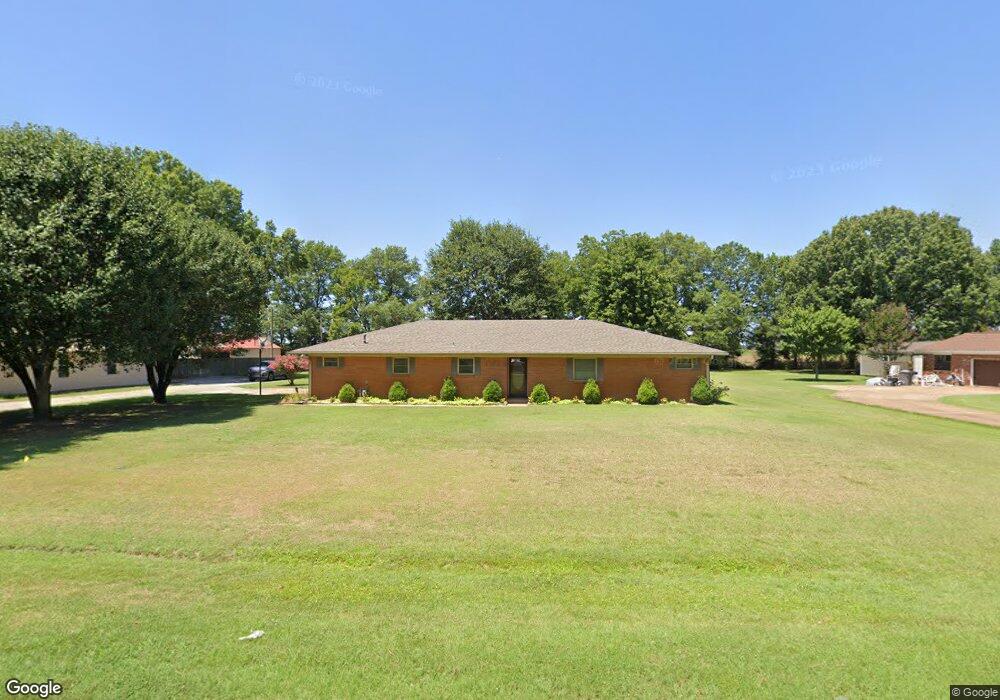
101 S Jim Denton St Tuckerman, AR 72473
Estimated Value: $137,101 - $216,000
Studio
2
Baths
1,984
Sq Ft
$88/Sq Ft
Est. Value
About This Home
This home is located at 101 S Jim Denton St, Tuckerman, AR 72473 and is currently estimated at $174,700, approximately $88 per square foot. 101 S Jim Denton St is a home located in Jackson County with nearby schools including Tuckerman Elementary School, Swifton Middle School, and Tuckerman High School.
Ownership History
Date
Name
Owned For
Owner Type
Purchase Details
Closed on
Dec 14, 2005
Bought by
Kagen Mary Lynn and Kagen Hershal
Current Estimated Value
Purchase Details
Closed on
Mar 15, 2005
Bought by
Burton Jessie Ray and Burton Lenny R
Purchase Details
Closed on
Sep 5, 2002
Bought by
Roach Roach J and Roach Cheryl
Purchase Details
Closed on
Aug 1, 1993
Bought by
Roach Roach J and Roach Cheryl
Purchase Details
Closed on
Jan 1, 1986
Bought by
O'Dell To O'Brien
Purchase Details
Closed on
Jan 1, 1985
Bought by
Graham To O'Dell
Create a Home Valuation Report for This Property
The Home Valuation Report is an in-depth analysis detailing your home's value as well as a comparison with similar homes in the area
Purchase History
| Date | Buyer | Sale Price | Title Company |
|---|---|---|---|
| Kagen Mary Lynn | $125,000 | -- | |
| Burton Jessie Ray | $119,000 | -- | |
| Roach Roach J | -- | -- | |
| Roach Roach J | $78,900 | -- | |
| O'Dell To O'Brien | $9,500 | -- | |
| Graham To O'Dell | $10,000 | -- |
Source: Public Records
Tax History
| Year | Tax Paid | Tax Assessment Tax Assessment Total Assessment is a certain percentage of the fair market value that is determined by local assessors to be the total taxable value of land and additions on the property. | Land | Improvement |
|---|---|---|---|---|
| 2025 | $903 | $35,530 | $1,600 | $33,930 |
| 2024 | $321 | $35,530 | $1,600 | $33,930 |
| 2023 | $396 | $24,220 | $1,600 | $22,620 |
| 2022 | $447 | $24,220 | $1,600 | $22,620 |
| 2021 | $431 | $24,220 | $1,600 | $22,620 |
| 2020 | $431 | $24,220 | $1,600 | $22,620 |
| 2019 | $431 | $24,220 | $1,600 | $22,620 |
| 2018 | $454 | $20,930 | $800 | $20,130 |
| 2017 | $405 | $20,930 | $800 | $20,130 |
| 2015 | -- | $16,410 | $800 | $15,610 |
| 2014 | -- | $16,410 | $800 | $15,610 |
| 2013 | -- | $19,340 | $1,000 | $18,340 |
| 2012 | -- | $16,410 | $1,000 | $15,410 |
Source: Public Records
Map
Nearby Homes
- 101 N Jim Denton St
- 100 S Pecan Dr
- 304 Grace St
- 103 S Jim Denton St
- 101 N Pecan Dr
- 100 S Jim Denton St
- 102 S Jim Denton St
- 102 N Jim Denton St
- 103 N Pecan Dr
- 104 S Jim Denton St
- 207 Grace St
- 103 N Jim Denton St
- 105 S Jim Denton St
- 103 S Pecan Dr
- 208 Grace St
- 104 N Jim Denton St
- 105 N Pecan Dr
- 105 N Jim Denton St
- 104 N Pecan Dr
- 107 S Jim Denton St
Your Personal Tour Guide
Ask me questions while you tour the home.