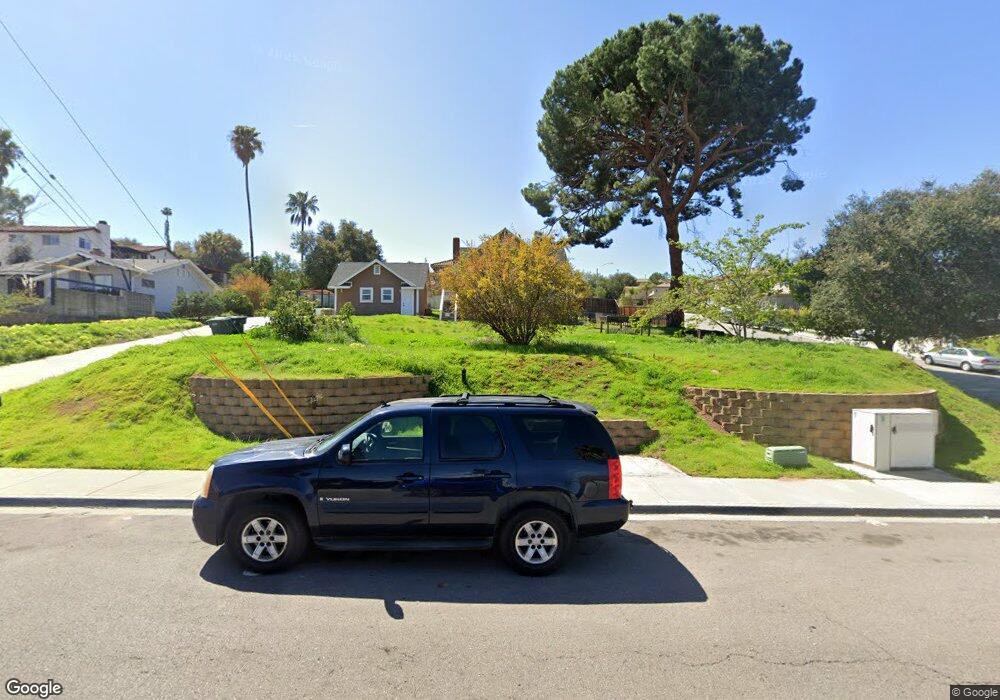
101 S Tulip St Escondido, CA 92025
Central Escondido NeighborhoodEstimated Value: $742,000 - $1,061,000
4
Beds
2
Baths
1,704
Sq Ft
$526/Sq Ft
Est. Value
About This Home
This home is located at 101 S Tulip St, Escondido, CA 92025 and is currently estimated at $896,966, approximately $526 per square foot. 101 S Tulip St is a home located in San Diego County with nearby schools including Felicita Elementary, Del Dios Academy of Arts & Sciences, and San Pasqual High School.
Ownership History
Date
Name
Owned For
Owner Type
Purchase Details
Closed on
Apr 5, 2010
Sold by
Fresh Start Real Estate Llc
Bought by
Ulloa Jose A and Ulloa Dawn E
Current Estimated Value
Home Financials for this Owner
Home Financials are based on the most recent Mortgage that was taken out on this home.
Original Mortgage
$16,425
Outstanding Balance
$10,950
Interest Rate
4.94%
Mortgage Type
Stand Alone Second
Estimated Equity
$886,016
Purchase Details
Closed on
Feb 17, 2010
Sold by
Morgan Lance and Lawrence Kristina
Bought by
Fresh Start Estate Llc
Home Financials for this Owner
Home Financials are based on the most recent Mortgage that was taken out on this home.
Original Mortgage
$308,811
Outstanding Balance
$210,707
Interest Rate
5.5%
Mortgage Type
FHA
Estimated Equity
$686,259
Purchase Details
Closed on
Jun 29, 2005
Sold by
Tulip Street Partners Llc
Bought by
Morgan Lance and Lawrence Kristina
Home Financials for this Owner
Home Financials are based on the most recent Mortgage that was taken out on this home.
Original Mortgage
$565,675
Interest Rate
4.99%
Mortgage Type
Purchase Money Mortgage
Purchase Details
Closed on
Jan 8, 2004
Sold by
Legacy Tulip Group Llc
Bought by
Tulip Street Partners Llc
Home Financials for this Owner
Home Financials are based on the most recent Mortgage that was taken out on this home.
Original Mortgage
$950,000
Interest Rate
6.02%
Mortgage Type
Purchase Money Mortgage
Purchase Details
Closed on
Oct 17, 2002
Sold by
North Star Land Co
Bought by
Legacy Tulip Group Llc
Home Financials for this Owner
Home Financials are based on the most recent Mortgage that was taken out on this home.
Original Mortgage
$837,500
Interest Rate
5.99%
Purchase Details
Closed on
May 17, 2000
Sold by
09-30-96 Et Al Vanderpol Ned & Dorinda Family and Dejong Silva
Bought by
Landis Industries Inc
Home Financials for this Owner
Home Financials are based on the most recent Mortgage that was taken out on this home.
Original Mortgage
$100,000
Interest Rate
7.82%
Purchase Details
Closed on
Oct 9, 1996
Sold by
Vanderpol Ned G and Vanderpol Dorinda
Bought by
Vanderpol Ned Gary and Vanderpol Dorinda Cornelia
Purchase Details
Closed on
Oct 19, 1994
Sold by
Community Thrift & Loan
Bought by
Vanderpol Ned G and Vanderpol Marinus
Home Financials for this Owner
Home Financials are based on the most recent Mortgage that was taken out on this home.
Original Mortgage
$143,600
Interest Rate
5%
Create a Home Valuation Report for This Property
The Home Valuation Report is an in-depth analysis detailing your home's value as well as a comparison with similar homes in the area
Home Values in the Area
Average Home Value in this Area
Purchase History
| Date | Buyer | Sale Price | Title Company |
|---|---|---|---|
| Ulloa Jose A | $328,500 | None Available | |
| Fresh Start Estate Llc | $311,102 | None Available | |
| Morgan Lance | $550,000 | First American Title Co | |
| Tulip Street Partners Llc | -- | First American Title Co | |
| Legacy Tulip Group Llc | $980,000 | Chicago Title Co | |
| Landis Industries Inc | $346,000 | Chicago Title Co | |
| Vanderpol Ned Gary | -- | -- | |
| Vanderpol Ned | -- | -- | |
| Vanderpol Ned G | $179,500 | Chicago Title Co |
Source: Public Records
Mortgage History
| Date | Status | Borrower | Loan Amount |
|---|---|---|---|
| Open | Ulloa Jose A | $16,425 | |
| Open | Ulloa Jose A | $308,811 | |
| Previous Owner | Morgan Lance | $565,675 | |
| Previous Owner | Tulip Street Partners Llc | $950,000 | |
| Previous Owner | Legacy Tulip Group Llc | $837,500 | |
| Previous Owner | Landis Industries Inc | $100,000 | |
| Previous Owner | Vanderpol Ned G | $143,600 | |
| Closed | Landis Industries Inc | $370,000 |
Source: Public Records
Tax History Compared to Growth
Tax History
| Year | Tax Paid | Tax Assessment Tax Assessment Total Assessment is a certain percentage of the fair market value that is determined by local assessors to be the total taxable value of land and additions on the property. | Land | Improvement |
|---|---|---|---|---|
| 2025 | $2,611 | $248,439 | $149,063 | $99,376 |
| 2024 | $2,611 | $229,941 | $137,964 | $91,977 |
| 2023 | $2,603 | $229,982 | $137,989 | $91,993 |
| 2022 | $2,632 | $230,549 | $138,329 | $92,220 |
| 2021 | $2,352 | $205,447 | $123,268 | $82,179 |
| 2020 | $2,319 | $201,690 | $121,014 | $80,676 |
| 2019 | $2,213 | $193,443 | $116,065 | $77,378 |
| 2018 | $2,142 | $188,788 | $113,272 | $75,516 |
| 2017 | $41 | $183,862 | $110,317 | $73,545 |
| 2016 | $1,989 | $174,888 | $104,932 | $69,956 |
| 2015 | $2,007 | $175,329 | $105,197 | $70,132 |
| 2014 | $2,012 | $179,568 | $107,740 | $71,828 |
Source: Public Records
Map
Nearby Homes
- 308 S Tulip St
- 934 W 4th Ave
- 509 W 2nd Ave
- 1049 W 5th Ave
- 215 Antoni Glen Unit 1112
- 225 Royal Glen Unit 408
- 335 W 3rd Ave
- 752 W 9th Ave
- 1001 Ontario St
- 159 W 5th Ave
- 521 W 10th Ave
- 127 W 5th Ave
- 0 Via Ambiente Unit 170043393
- 0 Avenida Apice Unit NDP2508857
- 1575 W Valley Pkwy Unit 25
- 1369 W 11th Ave
- 1756 Alhudson Dr
- 1001 S Hale Ave Unit 13
- 118 W 11th Ave
- 1110 Gaucho Place
- 123 S Tulip St
- 922 Brenna Hills Place
- 916 Grand Ct
- 135 S Tulip St
- 913 Brenna Hills Place
- 954 Brenna Hills Place
- 901 Brenna Hills Place
- 856 W Grand Ave
- 935 Brenna Hills Place
- 136 S Tulip St
- 947 Brenna Hills Place
- 960 Brenna Hills Place
- 116 N Tulip St
- 155 S Tulip St
- 121 N Tulip St
- 915 Grand Ct
- 971 Brenna Hills Place
- 925 Grand Ct
- 167 S Tulip St
- 988 Brenna Hills Place