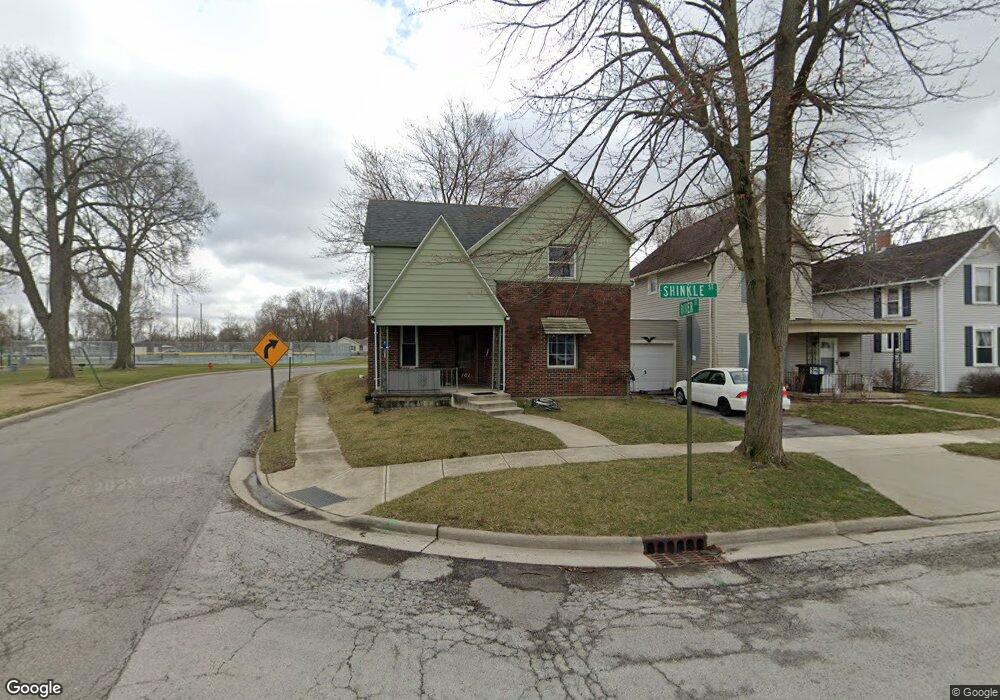
101 Shinkle St Findlay, OH 45840
Estimated Value: $106,000 - $193,000
3
Beds
3
Baths
1,888
Sq Ft
$78/Sq Ft
Est. Value
About This Home
This home is located at 101 Shinkle St, Findlay, OH 45840 and is currently estimated at $147,667, approximately $78 per square foot. 101 Shinkle St is a home located in Hancock County with nearby schools including Lincoln Elementary School, Donnell Middle School, and Findlay High School.
Ownership History
Date
Name
Owned For
Owner Type
Purchase Details
Closed on
Apr 22, 2016
Bought by
Reiter Holdings Llc
Current Estimated Value
Home Financials for this Owner
Home Financials are based on the most recent Mortgage that was taken out on this home.
Interest Rate
3.59%
Purchase Details
Closed on
Nov 18, 2005
Sold by
Deutsche Bank National Trust Co
Bought by
Snoke Christina R
Home Financials for this Owner
Home Financials are based on the most recent Mortgage that was taken out on this home.
Original Mortgage
$72,000
Interest Rate
6.13%
Mortgage Type
Purchase Money Mortgage
Purchase Details
Closed on
Apr 4, 2005
Sold by
Slough William
Bought by
Deutsche Bank National Trust Co
Purchase Details
Closed on
Nov 5, 1992
Bought by
Slough William L
Purchase Details
Closed on
Jun 5, 1991
Bought by
Shinkle Development Co
Purchase Details
Closed on
Nov 18, 1987
Bought by
Slough William L
Create a Home Valuation Report for This Property
The Home Valuation Report is an in-depth analysis detailing your home's value as well as a comparison with similar homes in the area
Home Values in the Area
Average Home Value in this Area
Purchase History
| Date | Buyer | Sale Price | Title Company |
|---|---|---|---|
| Reiter Holdings Llc | $57,000 | -- | |
| Snoke Christina R | $69,000 | -- | |
| Deutsche Bank National Trust Co | $112,000 | -- | |
| Slough William L | $79,000 | -- | |
| Shinkle Development Co | -- | -- | |
| Slough William L | -- | -- |
Source: Public Records
Mortgage History
| Date | Status | Borrower | Loan Amount |
|---|---|---|---|
| Closed | Reiter Holdings Llc | -- | |
| Previous Owner | Snoke Christina R | $72,000 |
Source: Public Records
Tax History
| Year | Tax Paid | Tax Assessment Tax Assessment Total Assessment is a certain percentage of the fair market value that is determined by local assessors to be the total taxable value of land and additions on the property. | Land | Improvement |
|---|---|---|---|---|
| 2024 | $1,363 | $37,400 | $3,410 | $33,990 |
| 2023 | $1,366 | $37,400 | $3,410 | $33,990 |
| 2022 | $1,361 | $37,400 | $3,410 | $33,990 |
| 2021 | $1,200 | $28,740 | $3,410 | $25,330 |
| 2020 | $1,200 | $28,740 | $3,410 | $25,330 |
| 2019 | $1,177 | $28,740 | $3,410 | $25,330 |
| 2018 | $1,055 | $23,640 | $2,790 | $20,850 |
| 2017 | $528 | $23,640 | $2,790 | $20,850 |
| 2016 | $1,051 | $23,640 | $2,790 | $20,850 |
| 2015 | $918 | $20,400 | $1,860 | $18,540 |
| 2014 | $918 | $20,400 | $1,860 | $18,540 |
| 2012 | $1,101 | $24,300 | $1,860 | $22,440 |
Source: Public Records
Map
Nearby Homes
- 602 Washington St
- 608 W Front St
- 807 W Main Cross St
- 407 Washington St
- 1032 Adams St
- 341 Defiance Ave
- 527 W Sandusky St
- 514 Liberty St
- 125 Cherry St
- 213 Cherry St
- 605 Davis St
- 719 Davis St
- 207 Ash Ave
- 815 Liberty St
- 705 Swing Ave
- 845 Hurd Ave
- 860 Hurd Ave
- 423 Elm St
- 239 Thimbleberry Dr
- 523 Center St
Your Personal Tour Guide
Ask me questions while you tour the home.