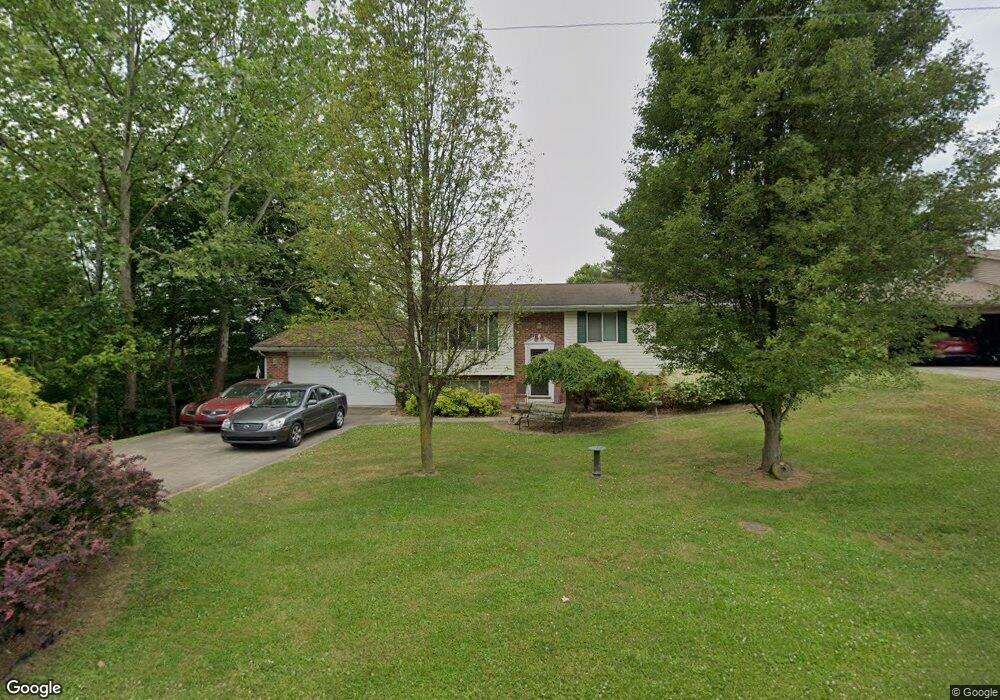
101 Skyvue Cir Marietta, OH 45750
Estimated Value: $253,009 - $299,000
5
Beds
2
Baths
1,120
Sq Ft
$240/Sq Ft
Est. Value
About This Home
This home is located at 101 Skyvue Cir, Marietta, OH 45750 and is currently estimated at $269,002, approximately $240 per square foot. 101 Skyvue Cir is a home located in Washington County with nearby schools including Marietta High School and Wood County Christian School.
Ownership History
Date
Name
Owned For
Owner Type
Purchase Details
Closed on
May 15, 2017
Sold by
Witten Raymond J and Witten Ray
Bought by
Witten Raymond J
Current Estimated Value
Home Financials for this Owner
Home Financials are based on the most recent Mortgage that was taken out on this home.
Original Mortgage
$154,246
Outstanding Balance
$127,493
Interest Rate
3.88%
Mortgage Type
VA
Estimated Equity
$141,509
Purchase Details
Closed on
Nov 19, 2007
Sold by
Mallett Eric J and Mallett Sarah C
Bought by
Witten Ray and Witten Jane Ann
Home Financials for this Owner
Home Financials are based on the most recent Mortgage that was taken out on this home.
Original Mortgage
$105,000
Interest Rate
6.47%
Mortgage Type
Purchase Money Mortgage
Purchase Details
Closed on
Jan 26, 2007
Sold by
Verderose Patty A and Guenther Howard E
Bought by
Mallett Eric J and Mallett Matthew D
Purchase Details
Closed on
May 27, 1993
Purchase Details
Closed on
Jul 7, 1987
Purchase Details
Closed on
Feb 10, 1987
Create a Home Valuation Report for This Property
The Home Valuation Report is an in-depth analysis detailing your home's value as well as a comparison with similar homes in the area
Home Values in the Area
Average Home Value in this Area
Purchase History
| Date | Buyer | Sale Price | Title Company |
|---|---|---|---|
| Witten Raymond J | -- | Lenders Title Solutions Llc | |
| Witten Ray | $132,000 | Attorney | |
| Mallett Eric J | $88,000 | Attorney | |
| -- | $85,500 | -- | |
| -- | $74,000 | -- | |
| -- | -- | -- |
Source: Public Records
Mortgage History
| Date | Status | Borrower | Loan Amount |
|---|---|---|---|
| Open | Witten Raymond J | $154,246 | |
| Closed | Witten Ray | $105,000 |
Source: Public Records
Tax History Compared to Growth
Tax History
| Year | Tax Paid | Tax Assessment Tax Assessment Total Assessment is a certain percentage of the fair market value that is determined by local assessors to be the total taxable value of land and additions on the property. | Land | Improvement |
|---|---|---|---|---|
| 2024 | $2,574 | $73,780 | $8,400 | $65,380 |
| 2023 | $2,574 | $73,780 | $8,400 | $65,380 |
| 2022 | $2,549 | $73,780 | $8,400 | $65,380 |
| 2021 | $2,256 | $61,280 | $8,450 | $52,830 |
| 2020 | $2,268 | $61,280 | $8,450 | $52,830 |
| 2019 | $2,263 | $61,280 | $8,450 | $52,830 |
| 2018 | $2,204 | $57,800 | $7,350 | $50,450 |
| 2017 | $2,199 | $57,800 | $7,350 | $50,450 |
| 2016 | $3,917 | $57,800 | $7,350 | $50,450 |
| 2015 | $2,081 | $52,110 | $7,470 | $44,640 |
| 2014 | $3,537 | $52,110 | $7,470 | $44,640 |
| 2013 | $1,964 | $52,110 | $7,470 | $44,640 |
Source: Public Records
Map
Nearby Homes
- 102 Skyvue Cir
- 149 Rauch Dr
- 902 Pike St
- 169 Morris Loop Rd
- 1585 County Road 9
- 145 Cornerstone Dr
- 904 Pike St
- 470 & 480 County House Ln
- 470 County House Ln
- 106 Briargate Dr
- 133 Brant Dr
- 102 Morningside Dr
- 1615 Browns Rd
- 19 Sherman Dr
- 27345 State Route 7
- 939 Pike St
- 122 Buells Cir
- 3205 Ohio 26
- 303 1/2 Ingleside Ave
- 150 Wells Ave
- 103 Skyvue Cir
- 120 Brandy Dr
- 122 Brandy Dr
- 105 Skyvue Cir
- 100 Skyvue Cir
- 118 Brandy Dr
- 124 Brandy Dr
- 123 Brandy Dr
- 116 Brandy Dr
- 125 Brandy Dr
- 121 Brandy Dr
- 200 Tennis Center Dr
- 104 Skyvue Cir
- 400 Tennis Center Dr
- 127 Brandy Dr
- 128 Brandy Dr
- 129 Brandy Dr
- 106 Skyvue Cir
- 101 Sunnyview Dr
- 117 Brandy Dr