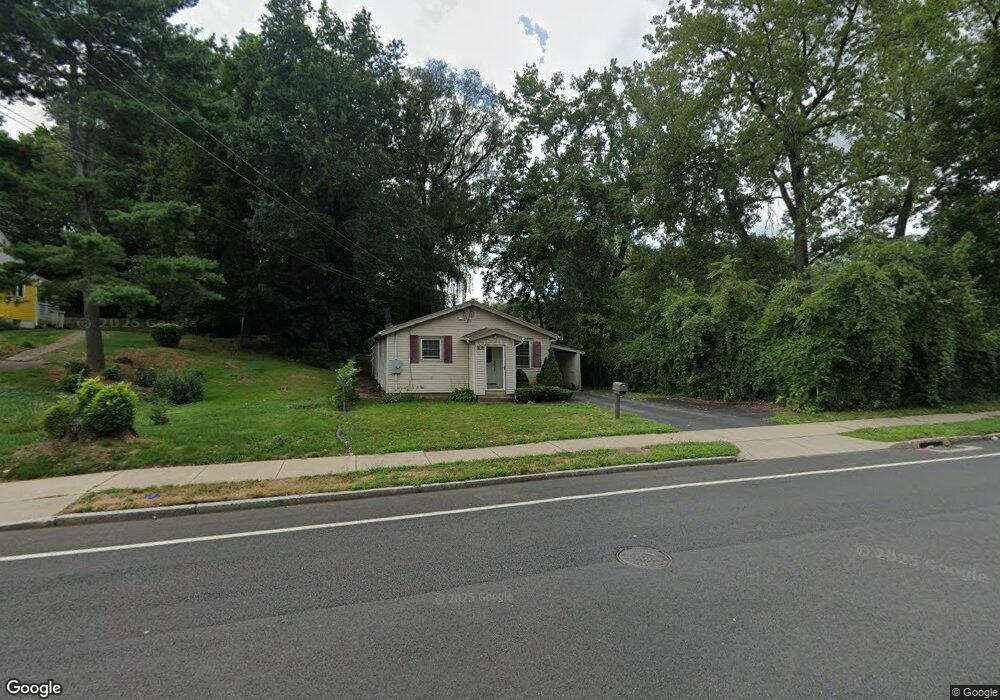
101 Tower Ave Hartford, CT 06120
North End NeighborhoodEstimated Value: $225,000 - $269,400
2
Beds
1
Bath
912
Sq Ft
$275/Sq Ft
Est. Value
About This Home
This home is located at 101 Tower Ave, Hartford, CT 06120 and is currently estimated at $250,350, approximately $274 per square foot. 101 Tower Ave is a home located in Hartford County with nearby schools including Capital Preparatory Magnet School, Perry Elementary School, and Ib Global Communications Academy.
Ownership History
Date
Name
Owned For
Owner Type
Purchase Details
Closed on
Oct 21, 2016
Sold by
Wnek Veronica C
Bought by
Anderson Kyle
Current Estimated Value
Home Financials for this Owner
Home Financials are based on the most recent Mortgage that was taken out on this home.
Original Mortgage
$139,428
Outstanding Balance
$112,917
Interest Rate
3.87%
Mortgage Type
FHA
Estimated Equity
$137,433
Purchase Details
Closed on
May 2, 2013
Sold by
Ms Ronnies Realty Llc
Bought by
Mnek Veronica C
Home Financials for this Owner
Home Financials are based on the most recent Mortgage that was taken out on this home.
Original Mortgage
$103,750
Interest Rate
3.43%
Mortgage Type
Stand Alone Refi Refinance Of Original Loan
Purchase Details
Closed on
Jul 27, 2005
Sold by
Anderson Kyle and Anderson Jacqueline
Bought by
Ms Ronnies Rlty Llc
Home Financials for this Owner
Home Financials are based on the most recent Mortgage that was taken out on this home.
Original Mortgage
$126,914
Interest Rate
5.66%
Create a Home Valuation Report for This Property
The Home Valuation Report is an in-depth analysis detailing your home's value as well as a comparison with similar homes in the area
Home Values in the Area
Average Home Value in this Area
Purchase History
| Date | Buyer | Sale Price | Title Company |
|---|---|---|---|
| Anderson Kyle | $142,000 | -- | |
| Mnek Veronica C | -- | -- | |
| Ms Ronnies Rlty Llc | $105,000 | -- |
Source: Public Records
Mortgage History
| Date | Status | Borrower | Loan Amount |
|---|---|---|---|
| Open | Ms Ronnies Rlty Llc | $139,428 | |
| Previous Owner | Ms Ronnies Rlty Llc | $103,750 | |
| Previous Owner | Ms Ronnies Rlty Llc | $126,914 |
Source: Public Records
Tax History Compared to Growth
Tax History
| Year | Tax Paid | Tax Assessment Tax Assessment Total Assessment is a certain percentage of the fair market value that is determined by local assessors to be the total taxable value of land and additions on the property. | Land | Improvement |
|---|---|---|---|---|
| 2025 | $4,556 | $66,077 | $6,762 | $59,315 |
| 2024 | $4,556 | $66,077 | $6,762 | $59,315 |
| 2023 | $4,556 | $66,077 | $6,762 | $59,315 |
| 2022 | $4,556 | $66,077 | $6,762 | $59,315 |
| 2021 | $3,294 | $44,345 | $6,685 | $37,660 |
| 2020 | $3,294 | $44,345 | $6,685 | $37,660 |
| 2019 | $3,294 | $44,345 | $6,685 | $37,660 |
| 2018 | $3,183 | $42,850 | $6,460 | $36,390 |
| 2016 | $2,338 | $31,469 | $6,152 | $25,317 |
| 2015 | $2,227 | $29,974 | $5,860 | $24,114 |
| 2014 | $2,172 | $29,242 | $5,717 | $23,525 |
Source: Public Records
Map
Nearby Homes
- 75 Cleveland Ave
- 82 Ashford St Unit 84
- 70 Ashford St
- 14 Bennett Cir
- 2657 Main St Unit 2659
- 142 Clark St
- 35 Loomis St
- 25 Judson St Unit C
- 158 Martin St Unit 160
- 33 Warren St
- 270 Bellevue St
- 275 Westland St
- 39 Capen St
- 238 Enfield St Unit 240
- 175 E Pershing St
- 551 Garden St Unit 553
- 147 Enfield St Unit 149
- 117 E Harold St
- 50 Mansfield St
- 59 Mansfield St Unit 61
- 95 Tower Ave
- 121 Tower Ave
- 87 Tower Ave
- 83 Tower Ave
- 3 Cambridge St
- 116 Montville St
- 98 Tower Ave
- 127 Tower Ave
- 79 Tower Ave
- 92 Tower Ave
- 120 Tower Ave Unit 122
- 7 Cambridge St
- 120 Montville St
- 8 Rutland St Unit 10
- 88 Tower Ave
- 75 Tower Ave
- 131 Tower Ave
- 124 Montville St
- 11 Cambridge St
- 99 Montville St