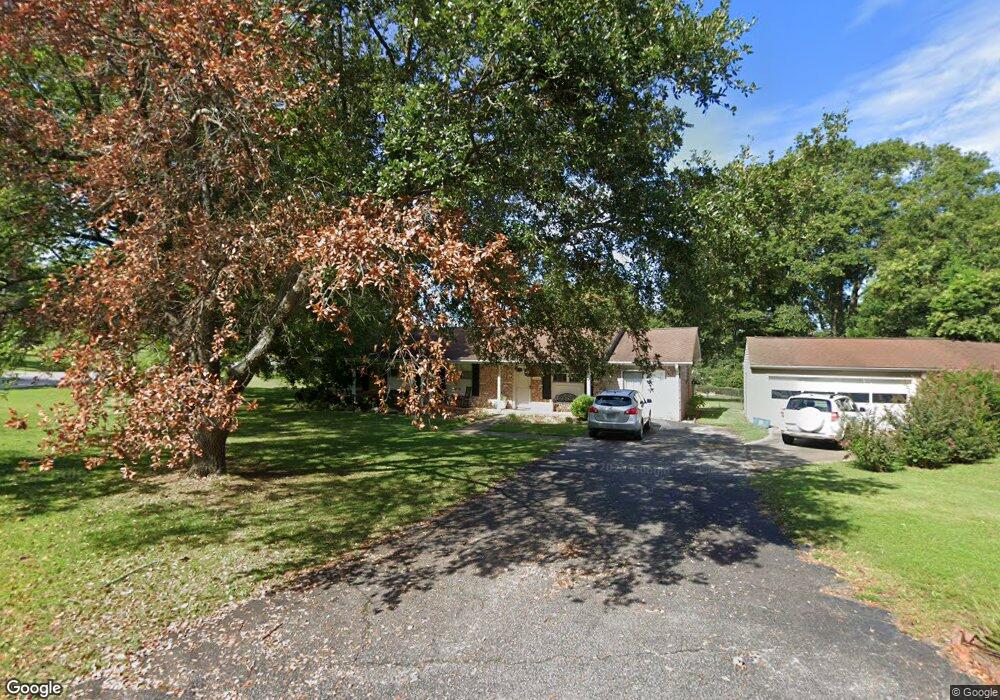
101 Vesper Cir Mauldin, SC 29662
Estimated Value: $277,000 - $310,010
3
Beds
2
Baths
1,820
Sq Ft
$162/Sq Ft
Est. Value
About This Home
This home is located at 101 Vesper Cir, Mauldin, SC 29662 and is currently estimated at $295,003, approximately $162 per square foot. 101 Vesper Cir is a home located in Greenville County with nearby schools including Greenbrier Elementary School, Mauldin Middle School, and Mauldin High School.
Ownership History
Date
Name
Owned For
Owner Type
Purchase Details
Closed on
Jul 6, 2017
Sold by
Dyke Brandon M
Bought by
Dyke Brandon M and Dyke Kimberly K
Current Estimated Value
Home Financials for this Owner
Home Financials are based on the most recent Mortgage that was taken out on this home.
Original Mortgage
$115,000
Outstanding Balance
$76,725
Interest Rate
3.9%
Mortgage Type
New Conventional
Estimated Equity
$218,278
Purchase Details
Closed on
Feb 15, 2007
Sold by
Koscher Ronald Dale and Hayne Sheri
Bought by
Dyke Brandon M
Home Financials for this Owner
Home Financials are based on the most recent Mortgage that was taken out on this home.
Original Mortgage
$82,400
Interest Rate
7.94%
Mortgage Type
Purchase Money Mortgage
Purchase Details
Closed on
Oct 5, 2006
Sold by
Spears Glenna Fay
Bought by
Koscher Ronald Dale and Koscher Daryl Scott
Purchase Details
Closed on
Mar 21, 2005
Sold by
Koscher Ronald D
Bought by
Koscher Ronald D
Create a Home Valuation Report for This Property
The Home Valuation Report is an in-depth analysis detailing your home's value as well as a comparison with similar homes in the area
Home Values in the Area
Average Home Value in this Area
Purchase History
| Date | Buyer | Sale Price | Title Company |
|---|---|---|---|
| Dyke Brandon M | -- | None Available | |
| Dyke Brandon M | $103,000 | None Available | |
| Koscher Ronald Dale | -- | None Available | |
| Koscher Ronald D | -- | -- |
Source: Public Records
Mortgage History
| Date | Status | Borrower | Loan Amount |
|---|---|---|---|
| Open | Dyke Brandon M | $115,000 | |
| Closed | Dyke Brandon M | $82,400 |
Source: Public Records
Tax History
| Year | Tax Paid | Tax Assessment Tax Assessment Total Assessment is a certain percentage of the fair market value that is determined by local assessors to be the total taxable value of land and additions on the property. | Land | Improvement |
|---|---|---|---|---|
| 2025 | $1,165 | $7,010 | $1,660 | $5,350 |
| 2024 | $1,165 | $6,100 | $970 | $5,130 |
| 2023 | $1,118 | $6,100 | $970 | $5,130 |
| 2022 | $1,054 | $6,100 | $970 | $5,130 |
| 2021 | $1,054 | $6,100 | $970 | $5,130 |
| 2020 | $974 | $5,300 | $840 | $4,460 |
| 2019 | $974 | $5,300 | $840 | $4,460 |
| 2018 | $972 | $5,300 | $840 | $4,460 |
| 2017 | $972 | $5,300 | $840 | $4,460 |
| 2016 | $933 | $132,550 | $21,000 | $111,550 |
| 2015 | $933 | $132,550 | $21,000 | $111,550 |
| 2014 | $874 | $124,569 | $21,390 | $103,179 |
Source: Public Records
Map
Nearby Homes
- 20 Golden Apple Trail
- 103 Teal Ln
- 202 N Main St
- 117 Wood Creek Rd
- 109 Muirwood Dr
- 201 Fern Hollow Way
- 311 Whatley Cir
- 419 Cedar Bluff Way
- 48 Ridgestone Cir
- 68 Endeavor Cir
- 9 Endeavor Cir
- 525 Martinshire Way
- 26 Sikes Cir
- 33 Endeavor Cir
- 66 Sikes Cir
- 515 Fagin Cir
- 413 Twist Cir
- 313 Mykonos Dr
- 315 Mykonos Dr
- 323 Mykonos Dr
- 103 Vesper Cir
- 200 White Dr
- 35 Golden Apple Trail
- 202 White Dr
- 100 Vesper Cir
- 102 Vesper Cir
- 33 Golden Apple Trail
- 105 Vesper Cir
- 201 Evening Way
- 201 White Dr
- 104 Vesper Cir
- 31 Golden Apple Trail
- 203 Evening Way
- 204 White Dr
- 44 Golden Apple Trail
- 117 Evening Way
- 29 Golden Apple Trail
- 200 Vesper Cir
- 205 Evening Way
- 42 Golden Apple Trail
Your Personal Tour Guide
Ask me questions while you tour the home.