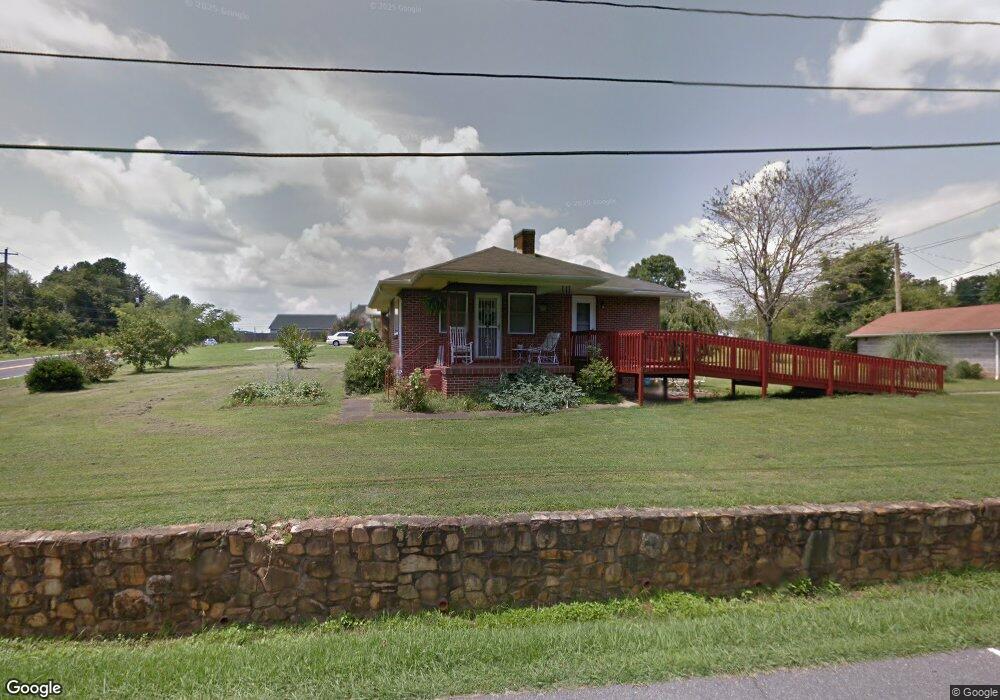
101 Whitley Rd Morganton, NC 28655
Estimated Value: $165,000 - $207,000
3
Beds
1
Bath
1,138
Sq Ft
$170/Sq Ft
Est. Value
About This Home
This home is located at 101 Whitley Rd, Morganton, NC 28655 and is currently estimated at $193,762, approximately $170 per square foot. 101 Whitley Rd is a home located in Burke County with nearby schools including Glen Alpine Elementary School, Table Rock Middle School, and Freedom High School.
Ownership History
Date
Name
Owned For
Owner Type
Purchase Details
Closed on
Jul 23, 2025
Sold by
Rader Cynthia G and Rader James
Bought by
Martinez Manuel Juan
Current Estimated Value
Home Financials for this Owner
Home Financials are based on the most recent Mortgage that was taken out on this home.
Original Mortgage
$166,920
Outstanding Balance
$166,637
Interest Rate
6.84%
Mortgage Type
FHA
Estimated Equity
$27,125
Purchase Details
Closed on
Sep 23, 2024
Sold by
Kale Arthur P
Bought by
Kale Arthur P and Rader Cynthia G
Purchase Details
Closed on
Jan 8, 2019
Sold by
Kale Paul G
Bought by
Kale Arthur P
Purchase Details
Closed on
Jan 5, 2012
Sold by
Kale Arthur P
Bought by
Kale Paul G and Kale Virginia P
Purchase Details
Closed on
Nov 22, 2010
Sold by
Kale Paul G and Kale Virginia P
Bought by
Kale Arthur P and Kale Paul G
Create a Home Valuation Report for This Property
The Home Valuation Report is an in-depth analysis detailing your home's value as well as a comparison with similar homes in the area
Home Values in the Area
Average Home Value in this Area
Purchase History
| Date | Buyer | Sale Price | Title Company |
|---|---|---|---|
| Martinez Manuel Juan | $170,000 | None Listed On Document | |
| Martinez Manuel Juan | $170,000 | None Listed On Document | |
| Kale Arthur P | -- | None Listed On Document | |
| Kale Arthur P | -- | None Available | |
| Kale Paul G | -- | None Available | |
| Kale Arthur P | -- | None Available |
Source: Public Records
Mortgage History
| Date | Status | Borrower | Loan Amount |
|---|---|---|---|
| Open | Martinez Manuel Juan | $166,920 | |
| Closed | Martinez Manuel Juan | $166,920 |
Source: Public Records
Tax History
| Year | Tax Paid | Tax Assessment Tax Assessment Total Assessment is a certain percentage of the fair market value that is determined by local assessors to be the total taxable value of land and additions on the property. | Land | Improvement |
|---|---|---|---|---|
| 2025 | $814 | $129,186 | $14,400 | $114,786 |
| 2024 | $816 | $129,186 | $14,400 | $114,786 |
| 2023 | $811 | $129,186 | $14,400 | $114,786 |
| 2022 | $665 | $83,953 | $12,600 | $71,353 |
| 2021 | $659 | $83,953 | $12,600 | $71,353 |
| 2020 | $655 | $83,953 | $12,600 | $71,353 |
| 2019 | $655 | $83,953 | $12,600 | $71,353 |
| 2018 | $671 | $86,162 | $14,400 | $71,762 |
| 2017 | $669 | $86,162 | $14,400 | $71,762 |
| 2016 | $651 | $86,162 | $14,400 | $71,762 |
| 2015 | $648 | $86,162 | $14,400 | $71,762 |
| 2014 | $647 | $86,162 | $14,400 | $71,762 |
| 2013 | $647 | $86,162 | $14,400 | $71,762 |
Source: Public Records
Map
Nearby Homes
- tbd Carbon City Rd
- tbd Carbon City Rd Unit 2
- 0 Carbon City Rd
- tbd Carbon City Rd Unit 4
- 104 Whitley Rd
- 100 Normandy Dr
- 204 Whitley Rd
- 826 Jamestown Rd
- 615 Carbon City Rd
- 113 Highlander St
- 112 Myrtle St
- 255 Reep Dr Unit 3
- 1305 Carbon City Rd Unit 3
- 7777 Reep Dr Unit 3
- 8888 Reep Dr Unit 2
- 9999 Reep Dr Unit 1
- 103 Emorywood Dr
- 107 Beechmont Dr
- 144 River Breeze Dr
- 112 Surrey Dr
- 1002 Carbon City Rd
- 100 Whitley Rd
- 9999 Carbon City Rd Unit 3
- tbd Carbon City Rd Unit 3
- VL Carbon City Rd
- V/L Carbon City Rd
- 103 Whitley Rd
- 102 Whitley Rd
- 1004 Carbon City Rd
- 105 Whitley Rd
- 912 Carbon City Rd
- 96 Elm St
- 92 Elm St
- 98 Elm St
- 107 Whitley Rd
- 90 Elm St
- 100 Elm St
- 106 Whitley Rd
- 102 Elm St
- 109 Whitley Rd
Your Personal Tour Guide
Ask me questions while you tour the home.