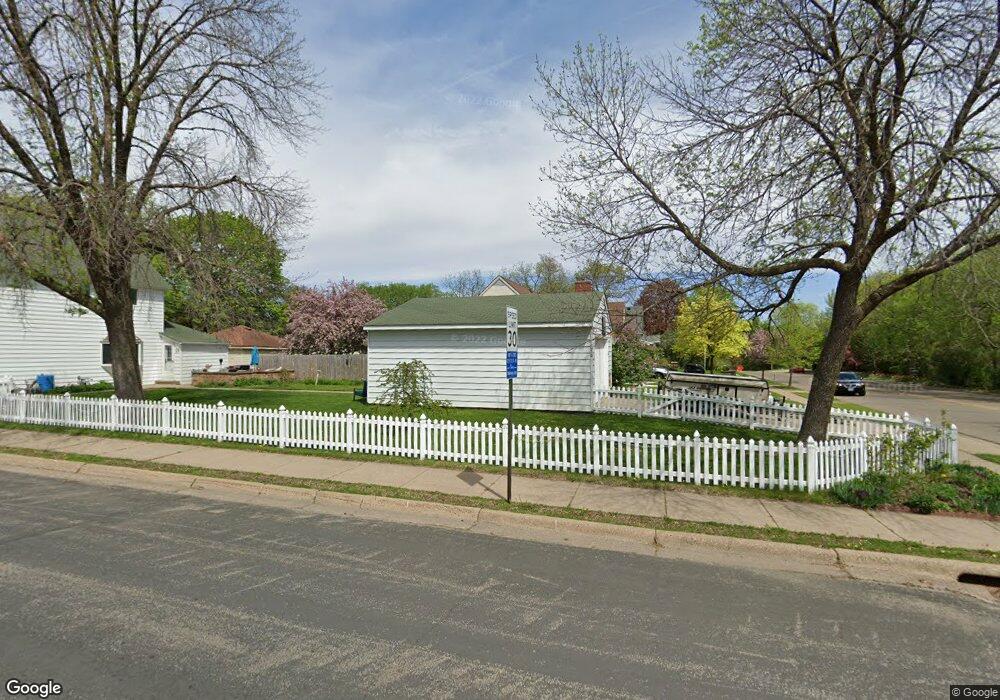
1010 1010 Thompson Ave South St. Paul, MN 55075
Estimated Value: $310,000 - $354,000
3
Beds
3
Baths
1,475
Sq Ft
$223/Sq Ft
Est. Value
About This Home
This home is located at 1010 1010 Thompson Ave, South St. Paul, MN 55075 and is currently estimated at $328,423, approximately $222 per square foot. 1010 1010 Thompson Ave is a home located in Dakota County with nearby schools including Lincoln Center Elementary, South St. Paul Secondary, and Holy Trinity Elementary School.
Ownership History
Date
Name
Owned For
Owner Type
Purchase Details
Closed on
May 16, 2016
Sold by
Nigon Adam D and Nigon Beth J
Bought by
Aarsvold Kaisie M and Aarsvold Jesse L
Current Estimated Value
Home Financials for this Owner
Home Financials are based on the most recent Mortgage that was taken out on this home.
Original Mortgage
$209,288
Outstanding Balance
$166,227
Interest Rate
3.59%
Mortgage Type
FHA
Estimated Equity
$162,196
Purchase Details
Closed on
Jul 31, 2006
Sold by
Anderson Richard A and Anderson Phyllis E
Bought by
Nigon Adam D and Nigon Beth J
Home Financials for this Owner
Home Financials are based on the most recent Mortgage that was taken out on this home.
Original Mortgage
$211,000
Interest Rate
6.5%
Mortgage Type
New Conventional
Create a Home Valuation Report for This Property
The Home Valuation Report is an in-depth analysis detailing your home's value as well as a comparison with similar homes in the area
Home Values in the Area
Average Home Value in this Area
Purchase History
| Date | Buyer | Sale Price | Title Company |
|---|---|---|---|
| Aarsvold Kaisie M | $213,151 | Home Title Inc | |
| Nigon Adam D | $219,000 | -- |
Source: Public Records
Mortgage History
| Date | Status | Borrower | Loan Amount |
|---|---|---|---|
| Open | Aarsvold Kaisie M | $209,288 | |
| Previous Owner | Nigon Adam D | $211,000 |
Source: Public Records
Tax History Compared to Growth
Tax History
| Year | Tax Paid | Tax Assessment Tax Assessment Total Assessment is a certain percentage of the fair market value that is determined by local assessors to be the total taxable value of land and additions on the property. | Land | Improvement |
|---|---|---|---|---|
| 2024 | $3,928 | $304,500 | $64,600 | $239,900 |
| 2023 | $3,928 | $289,600 | $65,000 | $224,600 |
| 2022 | $3,200 | $279,000 | $65,000 | $214,000 |
| 2021 | $2,966 | $243,200 | $56,500 | $186,700 |
| 2020 | $2,920 | $223,600 | $53,800 | $169,800 |
| 2019 | $2,584 | $225,500 | $51,200 | $174,300 |
| 2018 | $2,606 | $195,200 | $46,600 | $148,600 |
| 2017 | $2,299 | $189,200 | $44,400 | $144,800 |
| 2016 | $2,406 | $173,700 | $40,300 | $133,400 |
| 2015 | $2,287 | $152,202 | $33,628 | $118,574 |
| 2014 | -- | $153,401 | $33,680 | $119,721 |
| 2013 | -- | $127,568 | $28,517 | $99,051 |
Source: Public Records
Map
Nearby Homes
- 606 13th Ave N
- 518 8th Ave N
- 1200 Dwane St
- 916 4th St N
- 818 16th Ave N
- 522 16th Ave N
- 352 12th Ave N
- 351 12th Ave N
- 1010 Summit Ave
- 621 17th Ave N
- 425 16th Ave N
- 436 17th Ave N
- 921 17th Ave N
- 212 11th Ave N
- 1044 17th Ave N
- 119 10th Ave N
- 101 11th Ave N
- 116 11th Ave S
- 601 Levander Way Unit 101
- 601 Levander Way Unit 208
- 1010 Thompson Ave
- 711 10th Ave N
- 717 10th Ave N
- 721 10th Ave N
- 1001 Thompson Ave
- 655 655 10th-Avenue-n
- 655 655 10th Ave N
- 658 658 10th Ave N
- 655 10th Ave N
- 727 10th Ave N
- 700 11th Ave N
- 704 11th Ave N
- 658 10th Ave N
- 651 651 10th Ave N
- 712 11th Ave N
- 651 10th Ave N
- 658 11th Ave N
- 647 647 10th-Avenue-n
- 902 Thompson Ave
- 650 10th Ave N