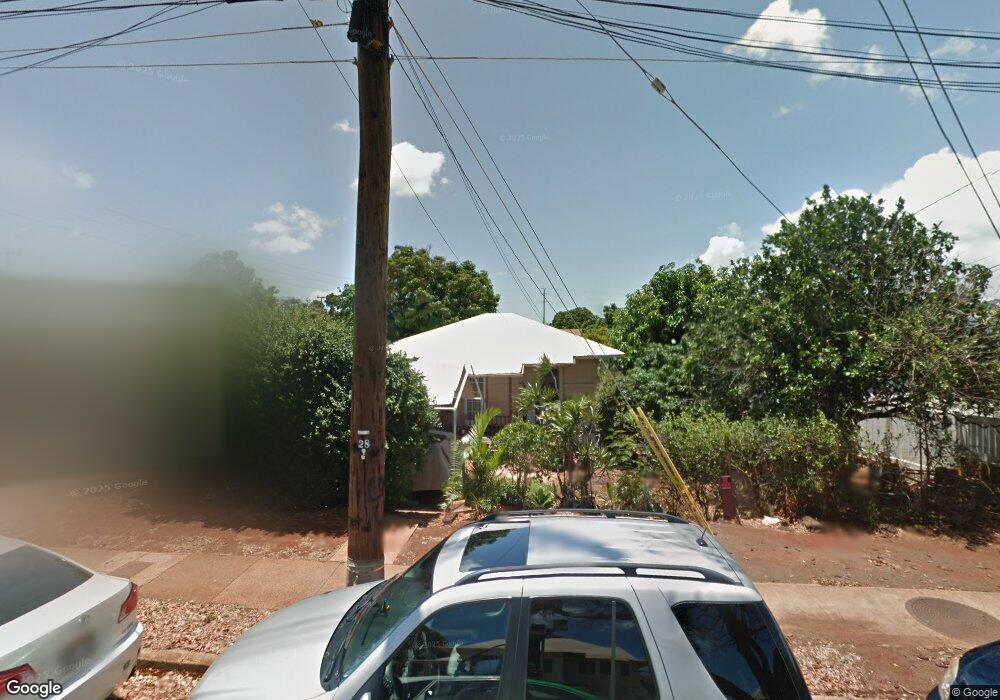
1010 10th Ave Honolulu, HI 96816
Kaimuki NeighborhoodEstimated Value: $963,000 - $1,382,000
3
Beds
1
Bath
1,001
Sq Ft
$1,137/Sq Ft
Est. Value
About This Home
This home is located at 1010 10th Ave, Honolulu, HI 96816 and is currently estimated at $1,138,352, approximately $1,137 per square foot. 1010 10th Ave is a home located in Honolulu County with nearby schools including King Liholiho Elementary School, Kaimuki Middle School, and Kalani High School.
Ownership History
Date
Name
Owned For
Owner Type
Purchase Details
Closed on
Nov 9, 2022
Sold by
Young Chew Sandra and York Gordon
Bought by
Le Tu Eric and On Tu Lynn
Current Estimated Value
Home Financials for this Owner
Home Financials are based on the most recent Mortgage that was taken out on this home.
Original Mortgage
$650,000
Outstanding Balance
$568,735
Interest Rate
6.23%
Mortgage Type
Balloon
Estimated Equity
$569,617
Purchase Details
Closed on
Nov 30, 2010
Sold by
Chew Sandra
Bought by
Chew Sandra Young and Young Glenn Duc On
Purchase Details
Closed on
Jan 1, 2001
Sold by
Young Ah Wai
Bought by
Chew Sandra Young and Young Glenn Duc On
Purchase Details
Closed on
Jun 9, 2000
Sold by
Young Ah Wai
Bought by
Young Ah Wai and Young Linda
Purchase Details
Closed on
Jul 31, 1997
Sold by
Young Ah Wai and Young Sybil Chang
Bought by
Young Ah Wai and Young Sybil Chang
Create a Home Valuation Report for This Property
The Home Valuation Report is an in-depth analysis detailing your home's value as well as a comparison with similar homes in the area
Home Values in the Area
Average Home Value in this Area
Purchase History
| Date | Buyer | Sale Price | Title Company |
|---|---|---|---|
| Le Tu Eric | $1,110,000 | Fidelity National Title | |
| Chew Sandra Young | -- | None Available | |
| Chew Sandra Young | -- | -- | |
| Young Ah Wai | -- | -- | |
| Young Ah Wai | -- | -- | |
| Young Ah Wai | -- | -- |
Source: Public Records
Mortgage History
| Date | Status | Borrower | Loan Amount |
|---|---|---|---|
| Open | Le Tu Eric | $650,000 |
Source: Public Records
Tax History Compared to Growth
Tax History
| Year | Tax Paid | Tax Assessment Tax Assessment Total Assessment is a certain percentage of the fair market value that is determined by local assessors to be the total taxable value of land and additions on the property. | Land | Improvement |
|---|---|---|---|---|
| 2025 | $3,898 | $1,329,500 | $1,251,300 | $78,200 |
| 2024 | $3,898 | $1,233,600 | $1,191,700 | $41,900 |
| 2023 | $3,852 | $1,300,600 | $1,191,700 | $108,900 |
| 2022 | $3,554 | $1,115,400 | $1,072,500 | $42,900 |
| 2021 | $3,607 | $1,130,500 | $989,100 | $141,400 |
| 2020 | $3,568 | $1,119,400 | $989,100 | $130,300 |
| 2019 | $3,343 | $1,035,000 | $953,400 | $81,600 |
| 2018 | $3,295 | $1,021,500 | $917,600 | $103,900 |
| 2017 | $3,310 | $1,025,700 | $926,100 | $99,600 |
| 2016 | $3,223 | $1,000,800 | $926,100 | $74,700 |
| 2015 | $3,064 | $955,300 | $889,100 | $66,200 |
| 2014 | $2,734 | $857,200 | $802,600 | $54,600 |
Source: Public Records
Map
Nearby Homes
- 1039 11th Ave
- 1103 10th Ave
- 833 10th Ave
- 1139 9th Ave Unit 1201
- 1139 9th Ave Unit 304
- 1139 9th Ave Unit 303
- 1139 9th Ave Unit 703
- 3625 Pahoa Ave
- 3427 Waialae Ave
- 718 10th Ave
- 3350 Sierra Dr Unit 601
- 911 6th Ave
- 3741 Harding Ave
- 1331 9th Ave
- 1331 9th Ave Unit A
- 766 Ocean View Dr
- 623 10th Ave
- 917 15th Ave
- 1222 15th Ave
- 1122 4th Ave Unit A
- 3470 Pahoa Ave
- 1018 10th Ave
- 1004 10th Ave
- 1020 10th Ave
- 3468A Pahoa Ave Unit 44D
- 3468 Pahoa Ave
- 1016 10th Ave
- 3464 Pahoa Ave
- 1011 10th Ave
- 1007 10th Ave
- 1021 10th Ave
- 1003 10th Ave
- 3458 Pahoa Ave
- 3456 Pahoa Ave
- 3477 Pahoa Ave
- 3512 Pahoa Ave
- 3454 Pahoa Ave Unit 2
- 3465 Pahoa Ave
- 3518B Pahoa Ave
- 952 10th Ave