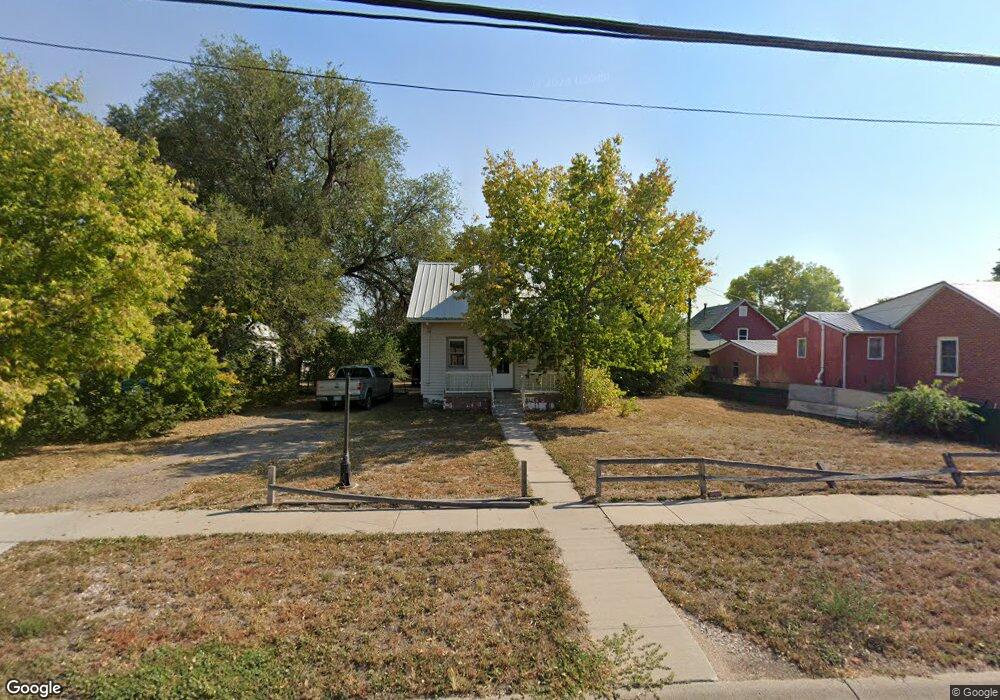
1010 10th St Gering, NE 69341
Estimated Value: $136,000 - $192,000
2
Beds
1
Bath
858
Sq Ft
$181/Sq Ft
Est. Value
About This Home
This home is located at 1010 10th St, Gering, NE 69341 and is currently estimated at $155,072, approximately $180 per square foot. 1010 10th St is a home located in Scotts Bluff County with nearby schools including Gering High School and Community Christian Elementary/Middle School.
Ownership History
Date
Name
Owned For
Owner Type
Purchase Details
Closed on
Oct 23, 2023
Sold by
Baker Brian and Baker Holly
Bought by
Ba Asset Management & Recovery Llc
Current Estimated Value
Purchase Details
Closed on
Jan 10, 2007
Sold by
Brown Tom Paulsen and Brown Tom P
Bought by
Baker Brian
Home Financials for this Owner
Home Financials are based on the most recent Mortgage that was taken out on this home.
Original Mortgage
$47,600
Interest Rate
7.37%
Mortgage Type
Adjustable Rate Mortgage/ARM
Create a Home Valuation Report for This Property
The Home Valuation Report is an in-depth analysis detailing your home's value as well as a comparison with similar homes in the area
Home Values in the Area
Average Home Value in this Area
Purchase History
| Date | Buyer | Sale Price | Title Company |
|---|---|---|---|
| Ba Asset Management & Recovery Llc | -- | None Listed On Document | |
| Baker Brian | $64,000 | -- |
Source: Public Records
Mortgage History
| Date | Status | Borrower | Loan Amount |
|---|---|---|---|
| Previous Owner | Baker Brian | $47,600 |
Source: Public Records
Tax History Compared to Growth
Tax History
| Year | Tax Paid | Tax Assessment Tax Assessment Total Assessment is a certain percentage of the fair market value that is determined by local assessors to be the total taxable value of land and additions on the property. | Land | Improvement |
|---|---|---|---|---|
| 2024 | $1,895 | $107,420 | $19,600 | $87,820 |
| 2023 | $1,629 | $75,986 | $4,615 | $71,371 |
| 2022 | $1,629 | $75,986 | $4,615 | $71,371 |
| 2021 | $1,545 | $71,317 | $4,615 | $66,702 |
| 2020 | $1,485 | $68,141 | $4,615 | $63,526 |
| 2019 | $1,458 | $68,566 | $5,040 | $63,526 |
| 2018 | $1,467 | $68,566 | $5,040 | $63,526 |
| 2017 | $1,328 | $61,981 | $5,040 | $56,941 |
| 2016 | $1,233 | $61,981 | $5,040 | $56,941 |
| 2015 | $1,196 | $60,323 | $5,040 | $55,283 |
| 2014 | $1,213 | $60,323 | $5,040 | $55,283 |
| 2012 | -- | $59,239 | $5,040 | $54,199 |
Source: Public Records
Map
Nearby Homes