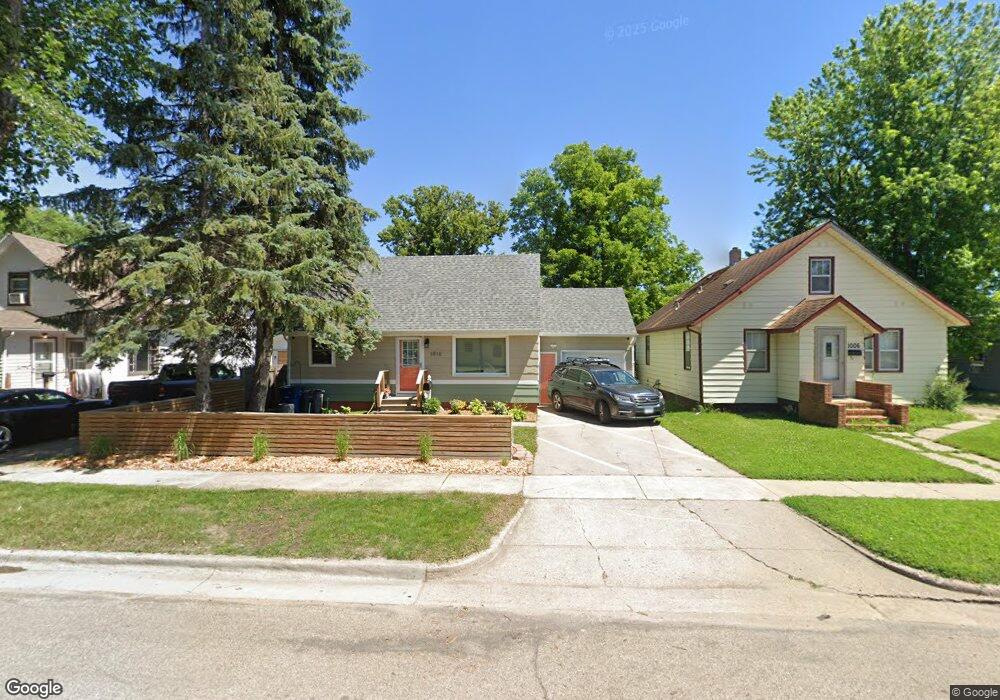
1010 11th St N Moorhead, MN 56560
Estimated Value: $176,000 - $233,000
4
Beds
1
Bath
900
Sq Ft
$233/Sq Ft
Est. Value
About This Home
This home is located at 1010 11th St N, Moorhead, MN 56560 and is currently estimated at $210,125, approximately $233 per square foot. 1010 11th St N is a home located in Clay County with nearby schools including R. Asp Elementary School, Horizon Middle School, and Moorhead High School.
Ownership History
Date
Name
Owned For
Owner Type
Purchase Details
Closed on
Sep 20, 2017
Sold by
Monson Daley M and Monson Emily
Bought by
Monson Daley M and Monson Emily
Current Estimated Value
Purchase Details
Closed on
May 30, 2012
Sold by
Kahler Cheryl A
Bought by
Manson Daley M
Home Financials for this Owner
Home Financials are based on the most recent Mortgage that was taken out on this home.
Original Mortgage
$96,002
Outstanding Balance
$66,657
Interest Rate
3.87%
Mortgage Type
FHA
Estimated Equity
$143,468
Create a Home Valuation Report for This Property
The Home Valuation Report is an in-depth analysis detailing your home's value as well as a comparison with similar homes in the area
Home Values in the Area
Average Home Value in this Area
Purchase History
| Date | Buyer | Sale Price | Title Company |
|---|---|---|---|
| Monson Daley M | -- | Title Co Of Fargo | |
| Manson Daley M | $98,560 | Northern Title Co |
Source: Public Records
Mortgage History
| Date | Status | Borrower | Loan Amount |
|---|---|---|---|
| Open | Manson Daley M | $96,002 |
Source: Public Records
Tax History Compared to Growth
Tax History
| Year | Tax Paid | Tax Assessment Tax Assessment Total Assessment is a certain percentage of the fair market value that is determined by local assessors to be the total taxable value of land and additions on the property. | Land | Improvement |
|---|---|---|---|---|
| 2025 | $2,410 | $195,200 | $33,200 | $162,000 |
| 2024 | $2,410 | $175,700 | $33,200 | $142,500 |
| 2023 | $2,394 | $169,700 | $30,600 | $139,100 |
| 2022 | $2,152 | $162,700 | $30,600 | $132,100 |
| 2021 | $1,740 | $147,000 | $28,100 | $118,900 |
| 2020 | $1,650 | $121,300 | $28,100 | $93,200 |
| 2019 | $1,538 | $118,300 | $28,100 | $90,200 |
| 2018 | $1,536 | $116,600 | $28,100 | $88,500 |
| 2017 | $1,426 | $116,600 | $28,100 | $88,500 |
| 2016 | $1,226 | $112,100 | $28,100 | $84,000 |
| 2015 | $924 | $90,100 | $21,500 | $68,600 |
| 2014 | $926 | $90,100 | $21,500 | $68,600 |
Source: Public Records
Map
Nearby Homes