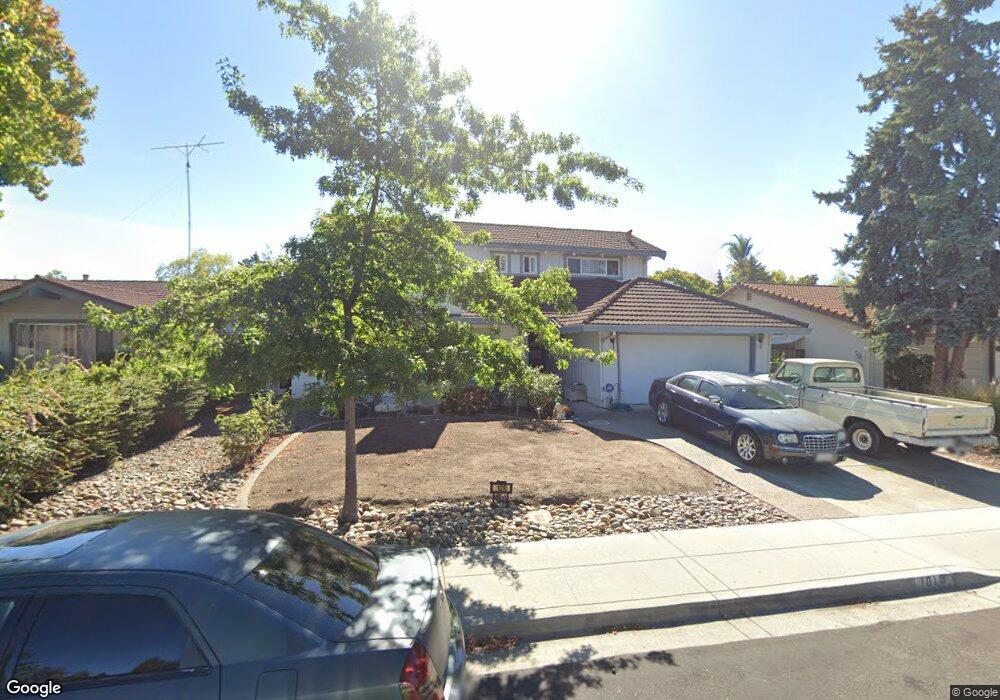
1010 Azalea Dr Sunnyvale, CA 94086
Ponderosa Park NeighborhoodEstimated Value: $2,695,000 - $2,898,000
4
Beds
2
Baths
2,163
Sq Ft
$1,291/Sq Ft
Est. Value
About This Home
This home is located at 1010 Azalea Dr, Sunnyvale, CA 94086 and is currently estimated at $2,792,612, approximately $1,291 per square foot. 1010 Azalea Dr is a home located in Santa Clara County with nearby schools including Braly Elementary School, Marian A. Peterson Middle School, and Adrian Wilcox High School.
Ownership History
Date
Name
Owned For
Owner Type
Purchase Details
Closed on
Jul 22, 2005
Sold by
Pear Bernadine
Bought by
Pear Bernadine
Current Estimated Value
Home Financials for this Owner
Home Financials are based on the most recent Mortgage that was taken out on this home.
Original Mortgage
$102,000
Outstanding Balance
$49,207
Interest Rate
4.5%
Mortgage Type
Purchase Money Mortgage
Estimated Equity
$2,743,405
Purchase Details
Closed on
May 26, 1998
Sold by
Pear Bernadine Pool
Bought by
Pear Bernadine
Purchase Details
Closed on
Sep 12, 1996
Sold by
Lundblade Richard Ivan and Lundblade Susan
Bought by
Pear Joseph and Pear Bernadine Pool
Purchase Details
Closed on
May 23, 1996
Sold by
Lundblade Richard I and Lundblade Susan
Bought by
Lundblade Richard Ivan and Lundblade Susan
Create a Home Valuation Report for This Property
The Home Valuation Report is an in-depth analysis detailing your home's value as well as a comparison with similar homes in the area
Home Values in the Area
Average Home Value in this Area
Purchase History
| Date | Buyer | Sale Price | Title Company |
|---|---|---|---|
| Pear Bernadine | -- | Financial Title Company | |
| Pear Bernadine | -- | Financial Title Company | |
| Pear Bernadine | -- | -- | |
| Pear Joseph | $421,000 | Old Republic Title Company | |
| Lundblade Richard Ivan | -- | -- |
Source: Public Records
Mortgage History
| Date | Status | Borrower | Loan Amount |
|---|---|---|---|
| Open | Pear Bernadine | $102,000 |
Source: Public Records
Tax History Compared to Growth
Tax History
| Year | Tax Paid | Tax Assessment Tax Assessment Total Assessment is a certain percentage of the fair market value that is determined by local assessors to be the total taxable value of land and additions on the property. | Land | Improvement |
|---|---|---|---|---|
| 2025 | $7,856 | $685,657 | $325,726 | $359,931 |
| 2024 | $7,856 | $672,214 | $319,340 | $352,874 |
| 2023 | $7,794 | $659,034 | $313,079 | $345,955 |
| 2022 | $7,689 | $646,113 | $306,941 | $339,172 |
| 2021 | $7,663 | $633,445 | $300,923 | $332,522 |
| 2020 | $7,523 | $626,951 | $297,838 | $329,113 |
| 2019 | $7,511 | $614,659 | $291,999 | $322,660 |
| 2018 | $7,031 | $602,608 | $286,274 | $316,334 |
| 2017 | $6,988 | $590,793 | $280,661 | $310,132 |
| 2016 | $6,872 | $579,209 | $275,158 | $304,051 |
| 2015 | $6,844 | $570,509 | $271,025 | $299,484 |
| 2014 | $6,520 | $559,334 | $265,716 | $293,618 |
Source: Public Records
Map
Nearby Homes
- 474 Sequoia Dr
- 999 W Evelyn Terrace Unit 54
- 236 Red Oak Dr E Unit P
- 248 Red Oak Dr E Unit A
- 1038 Barberry Terrace
- 301 Stone Pine Terrace Unit 4
- 201 Stone Pine Terrace Unit 2
- 308 Stone Pine Terrace Unit 419
- 202 Stone Pine Terrace Unit 6
- 202 Stone Pine Terrace
- 202 Stone Pine Terrace Unit 2
- 220 Red Oak Dr W Unit B
- 959 Reed Ave
- 1102 Althea Terrace Unit 1
- 308 Torrey Pine Terrace Unit 111
- 308 Torrey Pine Terrace Unit 419
- 308 Torrey Pine Terrace Unit 609
- 308 Torrey Pine Terrace Unit 620
- 308 Torrey Pine Terrace Unit 719
- 308 Torrey Pine Terrace