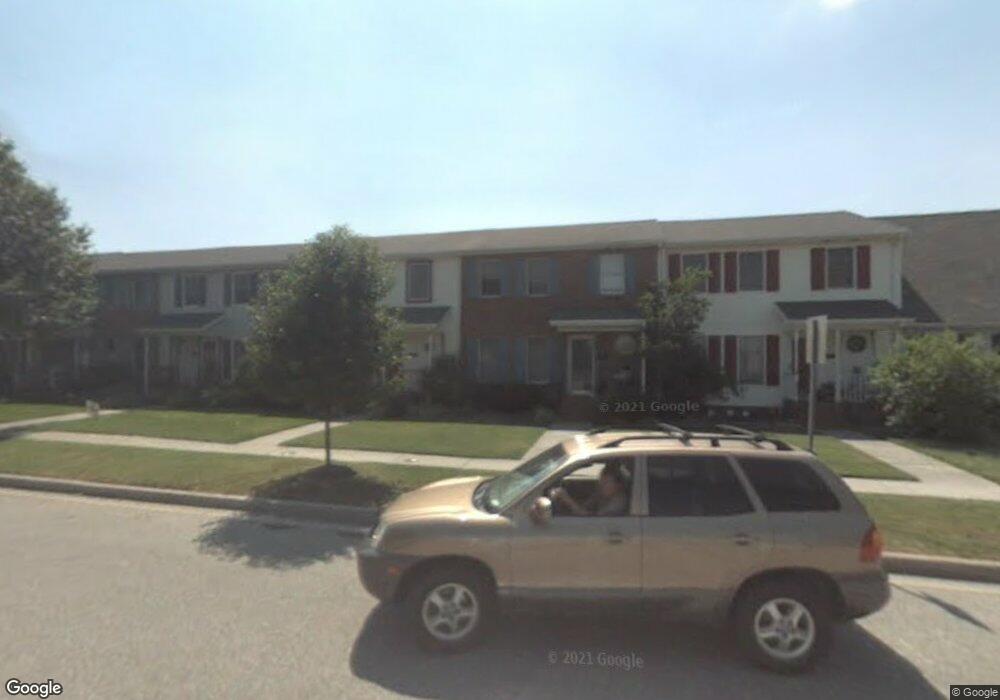
1010 Baccharis Dr Salisbury, MD 21804
South Salisbury NeighborhoodEstimated Value: $183,247 - $228,000
--
Bed
3
Baths
1,344
Sq Ft
$156/Sq Ft
Est. Value
About This Home
This home is located at 1010 Baccharis Dr, Salisbury, MD 21804 and is currently estimated at $209,812, approximately $156 per square foot. 1010 Baccharis Dr is a home located in Wicomico County with nearby schools including Charles H. Chipman Elementary School, Glen Avenue Elementary School, and Wicomico Middle School.
Ownership History
Date
Name
Owned For
Owner Type
Purchase Details
Closed on
Aug 31, 2010
Sold by
Dubbs Evelyn S
Bought by
Radel Debbie J and Maccarty Kimberly D
Current Estimated Value
Home Financials for this Owner
Home Financials are based on the most recent Mortgage that was taken out on this home.
Original Mortgage
$142,086
Outstanding Balance
$88,603
Interest Rate
3.37%
Mortgage Type
FHA
Estimated Equity
$121,209
Purchase Details
Closed on
Apr 25, 2002
Sold by
Payne Renee E
Bought by
Dubbs Evelyn S and Dubbs Willilam P
Purchase Details
Closed on
Jun 29, 2001
Sold by
Marks Phyllis Ann
Bought by
Payne Renee E
Purchase Details
Closed on
Apr 6, 1995
Sold by
Hand Kyle and Hand Robyn
Bought by
Benson Valerie A
Purchase Details
Closed on
Sep 23, 1994
Sold by
Bishop Richard and Bishop Adele
Bought by
Hand Kyle and Hand Robyn
Create a Home Valuation Report for This Property
The Home Valuation Report is an in-depth analysis detailing your home's value as well as a comparison with similar homes in the area
Home Values in the Area
Average Home Value in this Area
Purchase History
| Date | Buyer | Sale Price | Title Company |
|---|---|---|---|
| Radel Debbie J | $144,000 | -- | |
| Dubbs Evelyn S | $99,990 | -- | |
| Payne Renee E | -- | -- | |
| Benson Valerie A | $78,000 | -- | |
| Hand Kyle | $78,000 | -- |
Source: Public Records
Mortgage History
| Date | Status | Borrower | Loan Amount |
|---|---|---|---|
| Open | Radel Debbie J | $142,086 | |
| Closed | Hand Kyle | -- |
Source: Public Records
Tax History Compared to Growth
Tax History
| Year | Tax Paid | Tax Assessment Tax Assessment Total Assessment is a certain percentage of the fair market value that is determined by local assessors to be the total taxable value of land and additions on the property. | Land | Improvement |
|---|---|---|---|---|
| 2025 | $1,276 | $143,100 | $30,000 | $113,100 |
| 2024 | $1,276 | $133,100 | $0 | $0 |
| 2023 | $1,217 | $123,100 | $0 | $0 |
| 2022 | $1,152 | $113,100 | $30,000 | $83,100 |
| 2021 | $1,036 | $106,767 | $0 | $0 |
| 2020 | $1,036 | $100,433 | $0 | $0 |
| 2019 | $985 | $94,100 | $30,000 | $64,100 |
| 2018 | $1,935 | $94,100 | $30,000 | $64,100 |
| 2017 | $1,935 | $94,100 | $0 | $0 |
| 2016 | -- | $107,200 | $0 | $0 |
| 2015 | $2,170 | $107,200 | $0 | $0 |
| 2014 | $2,170 | $107,200 | $0 | $0 |
Source: Public Records
Map
Nearby Homes
- 1008 Caravan Way
- 907 Walbash St
- 906 Tamarac Dr
- 1068 Caravan Way
- 1178 Kestrel Way
- 930 Johnson Rd
- 922 W Schumaker Manor Dr
- 913 S Schumaker Dr
- 0 S Schumaker Dr Unit MDWC2019236
- 505 E College Ave
- 914 S Park Dr
- 1014 S Schumaker Dr
- 716 Edgar Dr
- 724 Edgar Dr
- 735 Canvasback Ct
- 704 Canvasback Ct
- 729 Shiloh St
- 925 Winding Way
- 915 Green Mor Ave
- 612 Cottontail Dr
- 1010 Baccharis Dr Unit 17
- 1012 Baccharis Dr
- 1008 Baccharis Dr
- 1006 Baccharis Dr
- 1014 Baccharis Dr
- 1004 Baccharis Dr
- 820 Johnson Rd
- 1002 Baccharis Dr
- 1000 Baccharis Dr
- 1019 Baccharis Dr
- 1021 Baccharis Dr
- 1017 Baccharis Dr
- 1023 Baccharis Dr
- 1025 Baccharis Dr
- 1027 Baccharis Dr
- 1011 Sumac Cir
- 1029 Baccharis Dr
- 1015 Baccharis Dr
- 1031 Baccharis Dr
- 1007 Sumac Cir