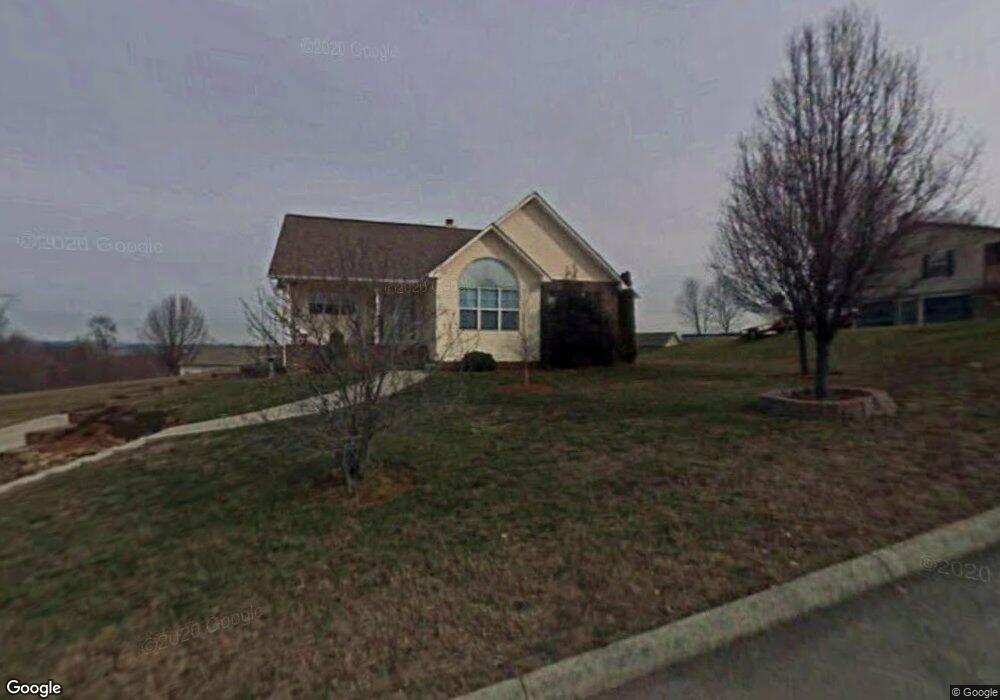
1010 Beth Dr Russellville, TN 37860
Estimated Value: $294,904 - $351,000
--
Bed
2
Baths
1,404
Sq Ft
$230/Sq Ft
Est. Value
About This Home
This home is located at 1010 Beth Dr, Russellville, TN 37860 and is currently estimated at $323,476, approximately $230 per square foot. 1010 Beth Dr is a home located in Hamblen County with nearby schools including Russellville Elementary School, East Ridge Middle School, and Morristown East High School.
Ownership History
Date
Name
Owned For
Owner Type
Purchase Details
Closed on
Oct 28, 2009
Sold by
Kesterson Stacey
Bought by
Smith Kimberly Shalain
Current Estimated Value
Home Financials for this Owner
Home Financials are based on the most recent Mortgage that was taken out on this home.
Original Mortgage
$143,355
Outstanding Balance
$93,270
Interest Rate
4.93%
Estimated Equity
$230,206
Purchase Details
Closed on
Feb 25, 1997
Bought by
Kesterson Stacey and Kesterson Paul W
Purchase Details
Closed on
Jun 23, 1995
Bought by
Scott Brooks
Purchase Details
Closed on
Dec 20, 1994
Bought by
Horner Charles K and Horner Gearlene
Purchase Details
Closed on
Nov 9, 1994
Bought by
Johnson Roy
Purchase Details
Closed on
Sep 30, 1988
Bought by
Horner Charles Keith and Horner Geralene
Purchase Details
Closed on
Mar 24, 1987
Bought by
Horner Charles Keith and Horner Geralene
Purchase Details
Closed on
Mar 1, 1962
Create a Home Valuation Report for This Property
The Home Valuation Report is an in-depth analysis detailing your home's value as well as a comparison with similar homes in the area
Home Values in the Area
Average Home Value in this Area
Purchase History
| Date | Buyer | Sale Price | Title Company |
|---|---|---|---|
| Smith Kimberly Shalain | $146,000 | -- | |
| Kesterson Stacey | $107,000 | -- | |
| Scott Brooks | $12,000 | -- | |
| Horner Charles K | $12,300 | -- | |
| Johnson Roy | $12,300 | -- | |
| Horner Charles Keith | -- | -- | |
| Horner Charles Keith | -- | -- | |
| -- | -- | -- |
Source: Public Records
Mortgage History
| Date | Status | Borrower | Loan Amount |
|---|---|---|---|
| Open | Not Available | $143,355 |
Source: Public Records
Tax History Compared to Growth
Tax History
| Year | Tax Paid | Tax Assessment Tax Assessment Total Assessment is a certain percentage of the fair market value that is determined by local assessors to be the total taxable value of land and additions on the property. | Land | Improvement |
|---|---|---|---|---|
| 2024 | $740 | $37,575 | $5,975 | $31,600 |
| 2023 | $740 | $37,575 | $0 | $0 |
| 2022 | $740 | $37,575 | $5,975 | $31,600 |
| 2021 | $740 | $37,575 | $5,975 | $31,600 |
| 2020 | $740 | $37,575 | $5,975 | $31,600 |
| 2019 | $683 | $32,050 | $5,775 | $26,275 |
| 2018 | $683 | $32,050 | $5,775 | $26,275 |
| 2017 | $683 | $32,050 | $5,775 | $26,275 |
| 2016 | $638 | $32,050 | $5,775 | $26,275 |
| 2015 | $593 | $32,050 | $5,775 | $26,275 |
| 2014 | -- | $32,050 | $5,775 | $26,275 |
| 2013 | -- | $34,750 | $0 | $0 |
Source: Public Records
Map
Nearby Homes
- 5751 Charlene Dr
- 1290 Little Mountain Rd
- 1341 Little Mountain Rd
- 00 Shinbone E Sugar Hollow Rd
- Tract 3 Shinbone Rd
- Tract 4 Shinbone Rd
- 1976/1986 Shinbone Rd
- Tract 2 Shinbone Rd
- 1475 Shinbone Rd
- 814 Pullen Rd
- 5740 Dodson Ferry Rd
- 5790 N 2nd St
- 6284 Old Russellville Pike
- 6330 Old Russellville Pike
- 233 Harvey Dr
- 1342 Slop Creek Rd
- 6563 E Andrew Johnson Hwy
- 6650 E Andrew Johnson Hwy
- 670 Jones Franklin Rd
- 1020 Beth Dr
- 1000 Beth Dr
- 5717 Christine Dr
- 5717 Christine Ln
- 5711 Christine Dr
- 1028 Beth Dr
- 990 Beth Dr
- 1011 Beth Dr
- 995 Beth Dr
- 5703 Christine Ln
- 5723 Christine Dr
- 5723 Christine Ln Unit S/D LITTLE MOUNTAIN
- 5723 Christine Ln
- 985 Beth Dr
- 980 Beth Dr
- 1032 Beth Dr
- 5719 Kay Dr
- 5729 Christine Dr
- 1029 Beth Dr
- 5703 Christine Dr