Estimated Value: $1,316,498 - $1,420,000
4
Beds
3
Baths
2,808
Sq Ft
$489/Sq Ft
Est. Value
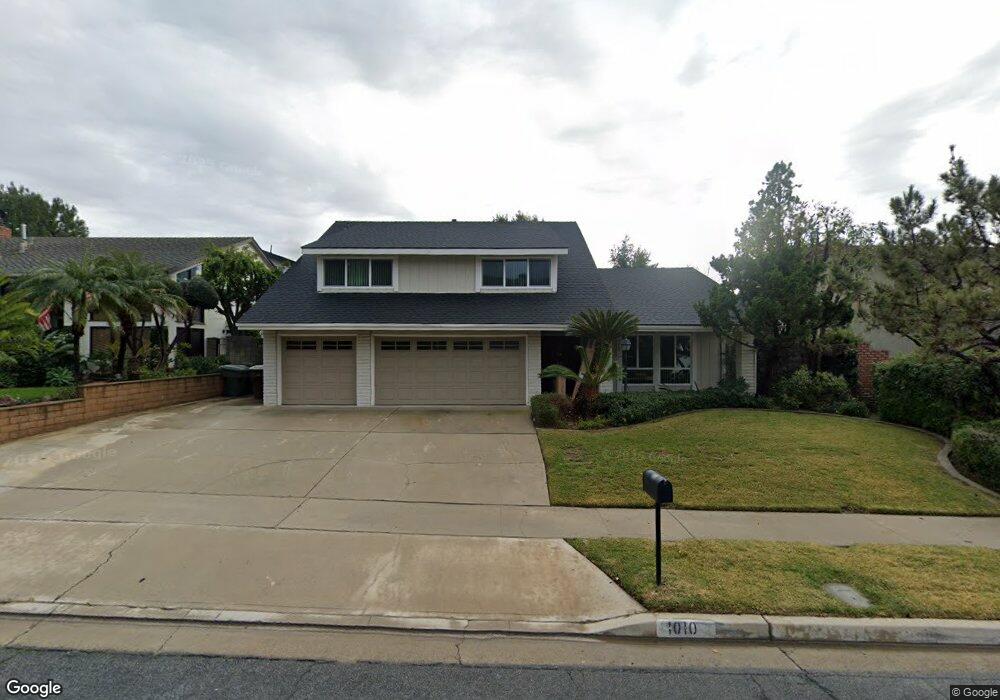
About This Home
This home is located at 1010 Birchcrest Ave, Brea, CA 92821 and is currently estimated at $1,372,375, approximately $488 per square foot. 1010 Birchcrest Ave is a home located in Orange County with nearby schools including Mariposa Elementary School, Brea Junior High School, and Brea-Olinda High School.
Ownership History
Date
Name
Owned For
Owner Type
Purchase Details
Closed on
Sep 2, 2017
Sold by
Summerfield Scott
Bought by
Summerfield Brian R
Current Estimated Value
Purchase Details
Closed on
Mar 17, 2015
Sold by
Summerfield Scott
Bought by
Geminis Propety Development Llc
Purchase Details
Closed on
Dec 21, 2012
Sold by
Summerfield Scott
Bought by
Geary Five Llc
Purchase Details
Closed on
Dec 20, 2012
Sold by
Summerfield John W
Bought by
Summerfield John W and Summerfield Lucille F
Purchase Details
Closed on
Dec 19, 2012
Sold by
Geminis Property Development Llc
Bought by
Summerfield Thomas W and Thomas W Summerfield Trust
Purchase Details
Closed on
Apr 5, 2000
Sold by
Geminis Proerty Development
Bought by
Geminis Property Development Llc
Create a Home Valuation Report for This Property
The Home Valuation Report is an in-depth analysis detailing your home's value as well as a comparison with similar homes in the area
Home Values in the Area
Average Home Value in this Area
Purchase History
| Date | Buyer | Sale Price | Title Company |
|---|---|---|---|
| Summerfield Brian R | -- | None Available | |
| Geminis Propety Development Llc | -- | None Available | |
| Geary Five Llc | -- | None Available | |
| Summerfield Brian R | -- | None Available | |
| Summerfield Scott | -- | None Available | |
| Summerfield John W | -- | None Available | |
| Summerfield Thomas W | -- | None Available | |
| Summerfield Thomas W | -- | None Available | |
| Geminis Property Development Llc | -- | -- |
Source: Public Records
Tax History
| Year | Tax Paid | Tax Assessment Tax Assessment Total Assessment is a certain percentage of the fair market value that is determined by local assessors to be the total taxable value of land and additions on the property. | Land | Improvement |
|---|---|---|---|---|
| 2025 | $4,399 | $372,923 | $113,951 | $258,972 |
| 2024 | $4,399 | $365,611 | $111,716 | $253,895 |
| 2023 | $4,277 | $358,443 | $109,526 | $248,917 |
| 2022 | $4,234 | $351,415 | $107,378 | $244,037 |
| 2021 | $4,156 | $344,525 | $105,273 | $239,252 |
| 2020 | $4,128 | $340,993 | $104,194 | $236,799 |
| 2019 | $4,021 | $334,307 | $102,151 | $232,156 |
| 2018 | $3,961 | $327,752 | $100,148 | $227,604 |
| 2017 | $3,888 | $321,326 | $98,184 | $223,142 |
| 2016 | $3,812 | $315,026 | $96,259 | $218,767 |
| 2015 | $3,759 | $310,295 | $94,814 | $215,481 |
| 2014 | $3,651 | $304,217 | $92,956 | $211,261 |
Source: Public Records
Map
Nearby Homes
- 18216 Midbury St
- 5621 Alwick Place
- 1446 Beechwood Dr
- 1060 Tropicana Way
- 846 Mooncrest Cir
- 1163 Delay St
- 1401 Havenhurst Dr
- 1142 Delay St
- 530 Palermo Way
- 1011 Delay St
- 1422 Bella Vista Dr
- 740 Laura St
- 1051 Site Dr Unit 236
- 1051 Site Dr Unit 255
- 1051 Site Dr Unit 25
- 1051 Site Dr Unit 251
- 1051 Site Dr Unit 233
- 900 De Jur St
- 470 N Palm St
- 1445 Arrow Wood Dr
- 1000 Birchcrest Ave
- 1020 Birchcrest Ave
- 1565 N Poinsettia Ave
- 1566 N Poinsettia Ave
- 990 Birchcrest Ave
- 1034 Birchcrest Ave
- 1601 Birchcrest Cir
- 1001 Birchcrest Ave
- 1563 N Poinsettia Ave
- 1011 Birchcrest Ave
- 980 Birchcrest Ave
- 1033 Birchcrest Ave
- 989 Oakcrest Ave
- 1576 Berenice Dr
- 1580 Berenice Dr
- 999 Oakcrest Ave
- 1568 Berenice Dr
- 1611 Birchcrest Cir
- 1025 Oakcrest Ave
- 979 Oakcrest Ave
Your Personal Tour Guide
Ask me questions while you tour the home.