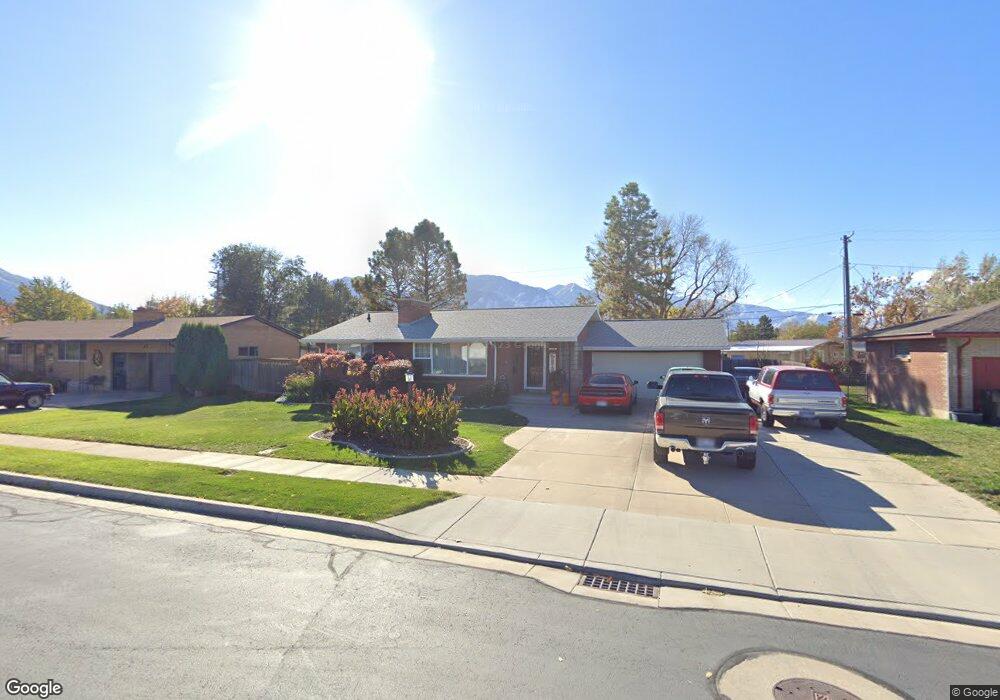
1010 Canyon Dr Spanish Fork, UT 84660
Estimated Value: $477,000 - $527,000
5
Beds
3
Baths
2,600
Sq Ft
$194/Sq Ft
Est. Value
About This Home
This home is located at 1010 Canyon Dr, Spanish Fork, UT 84660 and is currently estimated at $503,594, approximately $193 per square foot. 1010 Canyon Dr is a home located in Utah County with nearby schools including Larsen Elementary School, Spanish Fork Jr High School, and Spanish Fork High School.
Ownership History
Date
Name
Owned For
Owner Type
Purchase Details
Closed on
Jul 20, 2023
Sold by
Vonhoene Shane and Vonhoene Michelle
Bought by
Shane Von Hoene And Michelle Von Hoene Living and Von Hoene
Current Estimated Value
Purchase Details
Closed on
Dec 3, 2020
Sold by
Vonhoene Shane J and Von Hoene Michelle
Bought by
Vonhoene Shane and Von Hoene Michelle
Purchase Details
Closed on
Feb 2, 2012
Sold by
Houston Joseph K and Houston Karen A
Bought by
Vonhoene Shane J and Von Hoene Michelle E
Home Financials for this Owner
Home Financials are based on the most recent Mortgage that was taken out on this home.
Original Mortgage
$160,550
Interest Rate
3.86%
Mortgage Type
New Conventional
Create a Home Valuation Report for This Property
The Home Valuation Report is an in-depth analysis detailing your home's value as well as a comparison with similar homes in the area
Home Values in the Area
Average Home Value in this Area
Purchase History
| Date | Buyer | Sale Price | Title Company |
|---|---|---|---|
| Shane Von Hoene And Michelle Von Hoene Living | -- | None Listed On Document | |
| Vonhoene Shane | -- | Vanguard Title Ins Agcy | |
| Vonhoene Shane J | -- | Provo Land Title Company |
Source: Public Records
Mortgage History
| Date | Status | Borrower | Loan Amount |
|---|---|---|---|
| Previous Owner | Vonhoene Shane J | $160,550 |
Source: Public Records
Tax History
| Year | Tax Paid | Tax Assessment Tax Assessment Total Assessment is a certain percentage of the fair market value that is determined by local assessors to be the total taxable value of land and additions on the property. | Land | Improvement |
|---|---|---|---|---|
| 2025 | $2,211 | $262,625 | -- | -- |
| 2024 | $2,211 | $227,920 | $0 | $0 |
| 2023 | $2,175 | $224,455 | $0 | $0 |
| 2022 | $2,306 | $233,365 | $0 | $0 |
| 2021 | $1,986 | $321,500 | $99,600 | $221,900 |
| 2020 | $1,823 | $286,900 | $90,500 | $196,400 |
| 2019 | $1,645 | $272,400 | $76,000 | $196,400 |
| 2018 | $1,497 | $239,600 | $68,800 | $170,800 |
| 2017 | $1,346 | $115,775 | $0 | $0 |
| 2016 | $1,285 | $109,065 | $0 | $0 |
| 2015 | $1,144 | $95,975 | $0 | $0 |
| 2014 | $1,087 | $91,520 | $0 | $0 |
Source: Public Records
Map
Nearby Homes
- 2998 Canyon Dr Unit 333
- 3014 Canyon Dr Unit 332
- 325 S 1230 E
- 1330 E 410 S
- 2583 E 300 S Unit 21
- 973 E 60 S
- 1238 E 100 S
- 1434 E 410 S
- 1105 S 200 E
- 2256 E 760 S Unit 7
- 573 E 300 S
- 816 S 1300 #15gc E
- 789 S 1300 E
- 762 S 1360 E
- 762 S 1360 E Unit 25
- 834 S 1300 #16gc E
- 886 S 1240 E
- 815 S 1300 E Unit 34
- 1453 S Windy Ridge Dr Unit 1149
- 857 S 1300 E Unit 32
- 1030 Canyon Dr
- 980 Canyon Dr
- 998 E Sterling Cir
- 1001 E Sterling Cir
- 962 Canyon Dr
- 1060 Canyon Dr
- 1005 Canyon Dr
- 965 E Sterling Dr
- 981 Canyon Dr
- 981 Mt Loafer Cir
- 1035 Canyon Dr
- 975 E Sterling Dr
- 963 Canyon Dr
- 428 S Nebo Dr
- 406 S Nebo Dr
- 942 Canyon Dr
- 963 Canyon Dr
- 945 E Sterling Dr
- 1003 E Sterling Cir
- 1003 Canyon Dr
Your Personal Tour Guide
Ask me questions while you tour the home.