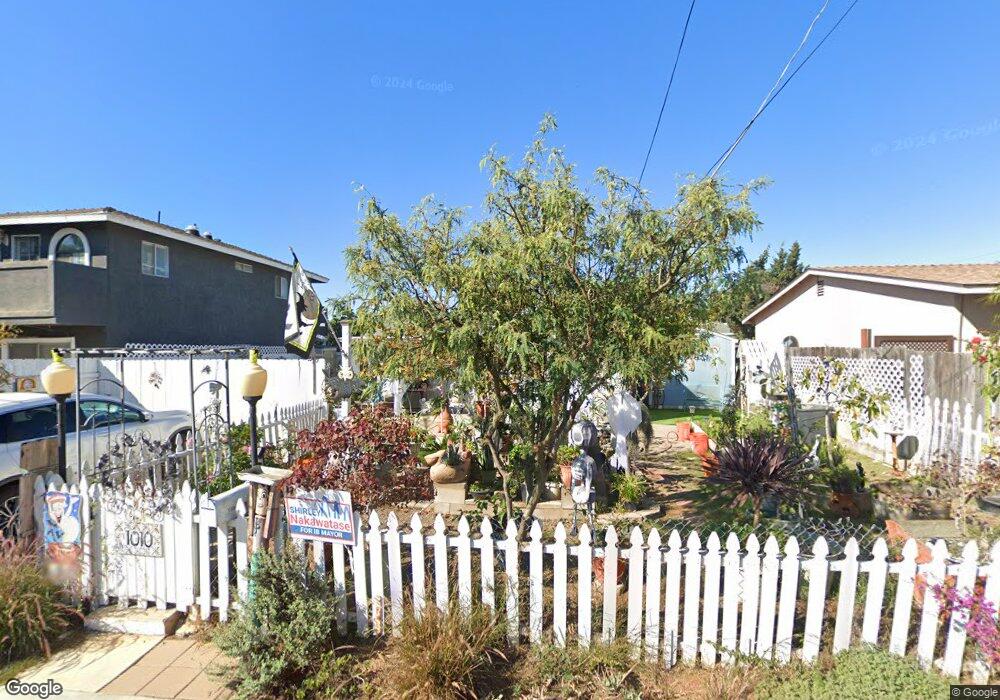
1010 Delaware St Imperial Beach, CA 91932
Estimated Value: $663,690 - $709,000
2
Beds
1
Bath
648
Sq Ft
$1,058/Sq Ft
Est. Value
About This Home
This home is located at 1010 Delaware St, Imperial Beach, CA 91932 and is currently estimated at $685,673, approximately $1,058 per square foot. 1010 Delaware St is a home located in San Diego County with nearby schools including Mar Vista Academy, Mar Vista Senior High School, and Imperial Beach Charter School.
Ownership History
Date
Name
Owned For
Owner Type
Purchase Details
Closed on
May 15, 2013
Sold by
Pena Gregory and Pena Linda
Bought by
Pena Gregory and Pena Linda
Current Estimated Value
Home Financials for this Owner
Home Financials are based on the most recent Mortgage that was taken out on this home.
Original Mortgage
$187,500
Outstanding Balance
$132,265
Interest Rate
3.38%
Mortgage Type
New Conventional
Estimated Equity
$553,408
Purchase Details
Closed on
Jun 30, 2009
Sold by
Federal National Mortgage Association
Bought by
Pena Greg and Pena Linda
Home Financials for this Owner
Home Financials are based on the most recent Mortgage that was taken out on this home.
Original Mortgage
$200,396
Interest Rate
5.31%
Mortgage Type
FHA
Purchase Details
Closed on
Nov 19, 2008
Sold by
Due Steve
Bought by
Federal National Mortgage Association
Purchase Details
Closed on
Oct 8, 2007
Sold by
Lam Due Sophia A
Bought by
Due Steve
Home Financials for this Owner
Home Financials are based on the most recent Mortgage that was taken out on this home.
Original Mortgage
$320,000
Interest Rate
6.38%
Mortgage Type
New Conventional
Purchase Details
Closed on
Sep 11, 2007
Sold by
Dny Enterprise Inc
Bought by
Due Steve
Home Financials for this Owner
Home Financials are based on the most recent Mortgage that was taken out on this home.
Original Mortgage
$320,000
Interest Rate
6.38%
Mortgage Type
New Conventional
Purchase Details
Closed on
Aug 6, 2007
Sold by
Kinsella John R and Kinsella Francine E
Bought by
Dny Enterprises Inc
Home Financials for this Owner
Home Financials are based on the most recent Mortgage that was taken out on this home.
Original Mortgage
$247,500
Interest Rate
6.62%
Mortgage Type
Purchase Money Mortgage
Purchase Details
Closed on
Feb 20, 2006
Sold by
Kinsella John R
Bought by
Kinsella John R and Kinsella Francine E
Purchase Details
Closed on
Oct 19, 2005
Sold by
Kinsella John R and Huntington Karen M
Bought by
Kinsella John R
Create a Home Valuation Report for This Property
The Home Valuation Report is an in-depth analysis detailing your home's value as well as a comparison with similar homes in the area
Home Values in the Area
Average Home Value in this Area
Purchase History
| Date | Buyer | Sale Price | Title Company |
|---|---|---|---|
| Pena Gregory | -- | Lawyers Title Company | |
| Pena Greg | $204,500 | Lsi Title Agency | |
| Federal National Mortgage Association | $339,181 | First American Title Ins Co | |
| Due Steve | -- | Southland Title Of San Diego | |
| Due Steve | -- | None Available | |
| Dny Enterprises Inc | $275,000 | Fidelity National Title Co | |
| Kinsella John R | -- | None Available | |
| Kinsella John R | -- | -- |
Source: Public Records
Mortgage History
| Date | Status | Borrower | Loan Amount |
|---|---|---|---|
| Open | Pena Gregory | $187,500 | |
| Closed | Pena Greg | $200,396 | |
| Previous Owner | Due Steve | $320,000 | |
| Previous Owner | Dny Enterprises Inc | $247,500 |
Source: Public Records
Tax History Compared to Growth
Tax History
| Year | Tax Paid | Tax Assessment Tax Assessment Total Assessment is a certain percentage of the fair market value that is determined by local assessors to be the total taxable value of land and additions on the property. | Land | Improvement |
|---|---|---|---|---|
| 2025 | $3,634 | $263,441 | $180,708 | $82,733 |
| 2024 | $3,634 | $258,276 | $177,165 | $81,111 |
| 2023 | $3,591 | $253,213 | $173,692 | $79,521 |
| 2022 | $3,572 | $248,249 | $170,287 | $77,962 |
| 2021 | $3,532 | $243,383 | $166,949 | $76,434 |
| 2020 | $3,323 | $240,889 | $165,238 | $75,651 |
| 2019 | $3,268 | $236,167 | $161,999 | $74,168 |
| 2018 | $3,218 | $231,537 | $158,823 | $72,714 |
| 2017 | $140 | $226,998 | $155,709 | $71,289 |
| 2016 | $2,937 | $222,548 | $152,656 | $69,892 |
| 2015 | $2,899 | $219,206 | $150,363 | $68,843 |
| 2014 | $2,890 | $214,913 | $147,418 | $67,495 |
Source: Public Records
Map
Nearby Homes