1010 E 3rd St Fowler, IN 47944
Estimated Value: $98,000 - $145,119
2
Beds
1
Bath
900
Sq Ft
$138/Sq Ft
Est. Value
About This Home
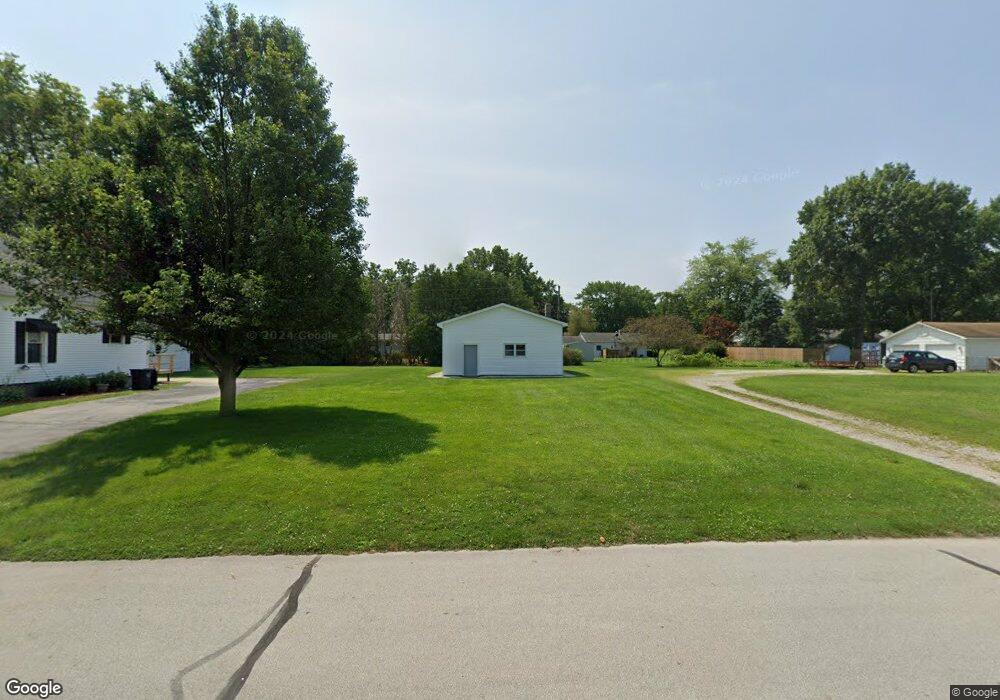
This home is located at 1010 E 3rd St, Fowler, IN 47944 and is currently estimated at $123,780, approximately $137 per square foot. 1010 E 3rd St is a home located in Benton County with nearby schools including Benton Central Junior/Senior High School and Sacred Heart Elementary School.
Ownership History
Date
Name
Owned For
Owner Type
Purchase Details
Closed on
Mar 31, 2021
Sold by
Garcia Jamie R
Bought by
Gill Vica
Current Estimated Value
Home Financials for this Owner
Home Financials are based on the most recent Mortgage that was taken out on this home.
Original Mortgage
$52,000
Outstanding Balance
$46,356
Interest Rate
2.9%
Mortgage Type
Balloon
Estimated Equity
$77,424
Purchase Details
Closed on
Dec 30, 2020
Sold by
Gill Frank Est
Bought by
Gill Vica and Gill Frank
Purchase Details
Closed on
Aug 31, 2000
Sold by
Not Provided
Bought by
Not Provided
Create a Home Valuation Report for This Property
The Home Valuation Report is an in-depth analysis detailing your home's value as well as a comparison with similar homes in the area
Purchase History
| Date | Buyer | Sale Price | Title Company |
|---|---|---|---|
| Gill Vica | -- | None Available | |
| Gill Vica | -- | None Available | |
| Not Provided | $49,500 | -- |
Source: Public Records
Mortgage History
| Date | Status | Borrower | Loan Amount |
|---|---|---|---|
| Open | Gill Vica | $52,000 |
Source: Public Records
Tax History
| Year | Tax Paid | Tax Assessment Tax Assessment Total Assessment is a certain percentage of the fair market value that is determined by local assessors to be the total taxable value of land and additions on the property. | Land | Improvement |
|---|---|---|---|---|
| 2025 | $718 | $125,300 | $9,200 | $116,100 |
| 2024 | $718 | $125,900 | $9,200 | $116,700 |
| 2023 | $704 | $111,900 | $8,300 | $103,600 |
| 2022 | $857 | $92,700 | $8,300 | $84,400 |
| 2021 | $588 | $76,700 | $8,300 | $68,400 |
| 2020 | $480 | $68,100 | $8,300 | $59,800 |
| 2019 | $463 | $71,200 | $7,900 | $63,300 |
| 2018 | $297 | $63,000 | $7,900 | $55,100 |
| 2017 | $393 | $61,900 | $7,900 | $54,000 |
| 2016 | $369 | $56,700 | $7,900 | $48,800 |
| 2014 | $328 | $50,600 | $7,800 | $42,800 |
| 2013 | $328 | $47,700 | $7,400 | $40,300 |
Source: Public Records
Map
Nearby Homes
- 1009 E 4th St
- 201 S Grant Ave
- 909 E 8th St
- 305 N Lincoln Ave
- 902 E 8th St
- 601 E 3rd St
- 502 E 5th St
- 303 N Jackson Ave
- 501 E 7th St
- 602 S Park Dr
- 503 E 8th St
- 202 N Van Buren Ave
- 700 S Sharon Ave
- 307 N Madison Ave
- 310 E 7th St
- 307 N Washington Ave
- 206 E Maple St
- 705 N Adams Ave
- 111 W 4th St
- 703 W 2nd St
Your Personal Tour Guide
Ask me questions while you tour the home.