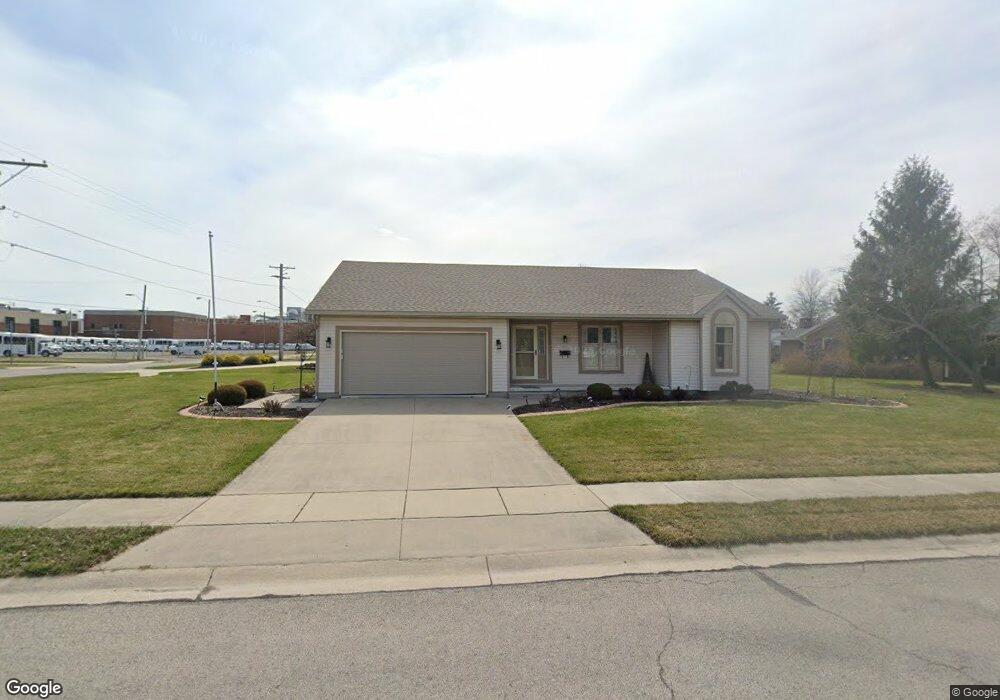
1010 E 7th St Ottawa, OH 45875
Estimated Value: $211,604 - $258,000
Studio
2
Baths
1,675
Sq Ft
$142/Sq Ft
Est. Value
About This Home
This home is located at 1010 E 7th St, Ottawa, OH 45875 and is currently estimated at $237,151, approximately $141 per square foot. 1010 E 7th St is a home located in Putnam County with nearby schools including Ottawa-Glandorf High School and Sts. Peter & Paul Catholic School.
Ownership History
Date
Name
Owned For
Owner Type
Purchase Details
Closed on
Sep 30, 2016
Sold by
Verhoff Jennifer L and Recker Jennifer L
Bought by
Kidd Betty L and The Kidd Living Trust
Current Estimated Value
Purchase Details
Closed on
Jun 15, 2010
Sold by
Balbaugh Elaine M and Balbaugh Dennis
Bought by
Recker Jennifer L
Home Financials for this Owner
Home Financials are based on the most recent Mortgage that was taken out on this home.
Original Mortgage
$125,550
Interest Rate
5.05%
Mortgage Type
New Conventional
Purchase Details
Closed on
Dec 17, 2007
Sold by
Steffan Kyle and Steffan Sarah
Bought by
Vorst Elaine M
Create a Home Valuation Report for This Property
The Home Valuation Report is an in-depth analysis detailing your home's value as well as a comparison with similar homes in the area
Home Values in the Area
Average Home Value in this Area
Purchase History
| Date | Buyer | Sale Price | Title Company |
|---|---|---|---|
| Kidd Betty L | $150,000 | Attorney | |
| Recker Jennifer L | $139,500 | Attorney | |
| Vorst Elaine M | $143,000 | None Available |
Source: Public Records
Mortgage History
| Date | Status | Borrower | Loan Amount |
|---|---|---|---|
| Previous Owner | Recker Jennifer L | $125,550 |
Source: Public Records
Tax History
| Year | Tax Paid | Tax Assessment Tax Assessment Total Assessment is a certain percentage of the fair market value that is determined by local assessors to be the total taxable value of land and additions on the property. | Land | Improvement |
|---|---|---|---|---|
| 2025 | $1,818 | $65,100 | $6,240 | $58,860 |
| 2024 | $1,778 | $64,760 | $6,240 | $58,520 |
| 2023 | $1,801 | $52,170 | $4,840 | $47,330 |
| 2022 | $1,597 | $52,172 | $4,841 | $47,331 |
| 2021 | $1,604 | $52,170 | $4,840 | $47,330 |
| 2020 | $1,614 | $43,280 | $4,340 | $38,940 |
| 2019 | $1,282 | $43,100 | $4,840 | $38,260 |
| 2018 | $1,263 | $43,100 | $4,840 | $38,260 |
| 2017 | $1,576 | $43,100 | $4,840 | $38,260 |
| 2016 | $1,576 | $43,280 | $4,340 | $38,940 |
| 2015 | $1,587 | $43,280 | $4,340 | $38,940 |
| 2014 | $1,565 | $43,280 | $4,340 | $38,940 |
| 2013 | $1,559 | $43,280 | $4,340 | $38,940 |
Source: Public Records
Map
Nearby Homes
- 740 E Main St
- 238 N Ohio Ave
- 717 E 2nd St
- 1535 E 3rd St
- 715 N Perry St
- 0 Sapphire St Unit 225029940
- 0 Sapphire St Unit 225046385
- 370 S Thomas St
- 309 Oakview Dr
- 1731 S Agner St
- 1823 S Agner St
- 717 & 717 1/2 & 721 E Third St
- 1997 E Main St
- 113 Crabapple Ln
- 331 Chippewa Dr
- 9896 Road M
- 9410 Road H
- 5666 State Route 224
- 12806 Road K
- 13592 Ohio 694
Your Personal Tour Guide
Ask me questions while you tour the home.