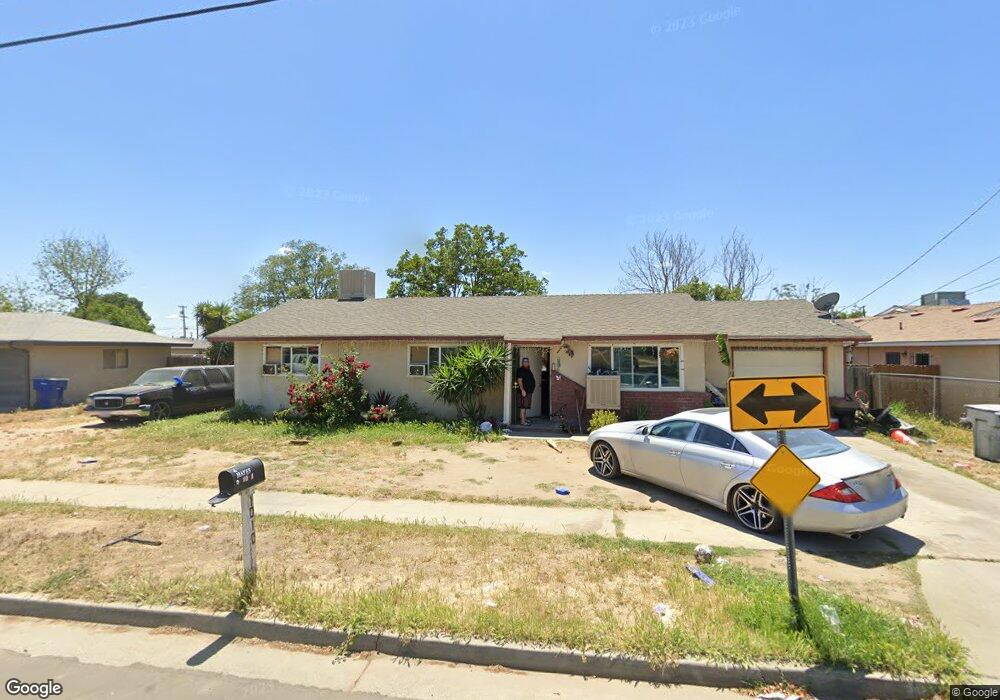
1010 E Chester Ave Fresno, CA 93706
Edison NeighborhoodEstimated Value: $222,000 - $309,000
3
Beds
2
Baths
1,170
Sq Ft
$232/Sq Ft
Est. Value
About This Home
This home is located at 1010 E Chester Ave, Fresno, CA 93706 and is currently estimated at $271,078, approximately $231 per square foot. 1010 E Chester Ave is a home located in Fresno County with nearby schools including West Fresno Middle School, Washington High School, and W.E.B DuBois Academy.
Ownership History
Date
Name
Owned For
Owner Type
Purchase Details
Closed on
May 10, 2021
Sold by
Simka Haroutiun Joseph
Bought by
My Vision Llc
Current Estimated Value
Purchase Details
Closed on
May 18, 2009
Sold by
Arax Mane
Bought by
Simka Haroutiun Joseph
Purchase Details
Closed on
May 1, 2007
Sold by
Beasley Antoinette C and Cooper Andriette
Bought by
Arax Mane
Purchase Details
Closed on
Oct 28, 2005
Sold by
Cooper A Ezell
Bought by
Cooper Beasley Antoinette L
Purchase Details
Closed on
Aug 9, 1999
Sold by
Ezell Cooper and Cooper Ezell
Bought by
Cooper Ezell
Home Financials for this Owner
Home Financials are based on the most recent Mortgage that was taken out on this home.
Original Mortgage
$20,000
Interest Rate
7.63%
Mortgage Type
Credit Line Revolving
Create a Home Valuation Report for This Property
The Home Valuation Report is an in-depth analysis detailing your home's value as well as a comparison with similar homes in the area
Home Values in the Area
Average Home Value in this Area
Purchase History
| Date | Buyer | Sale Price | Title Company |
|---|---|---|---|
| My Vision Llc | -- | None Available | |
| Simka Haroutiun Joseph | $27,000 | None Available | |
| Arax Mane | $110,000 | Fidelity National Title Co | |
| Cooper Beasley Antoinette L | -- | -- | |
| Cooper Ezell | -- | Financial Title Company |
Source: Public Records
Mortgage History
| Date | Status | Borrower | Loan Amount |
|---|---|---|---|
| Previous Owner | Cooper Ezell | $20,000 |
Source: Public Records
Tax History Compared to Growth
Tax History
| Year | Tax Paid | Tax Assessment Tax Assessment Total Assessment is a certain percentage of the fair market value that is determined by local assessors to be the total taxable value of land and additions on the property. | Land | Improvement |
|---|---|---|---|---|
| 2025 | $2,238 | $193,138 | $42,448 | $150,690 |
| 2023 | $2,208 | $185,640 | $40,800 | $144,840 |
| 2022 | $2,160 | $182,000 | $40,000 | $142,000 |
| 2021 | $1,976 | $32,115 | $17,842 | $14,273 |
| 2020 | $1,907 | $31,787 | $17,660 | $14,127 |
| 2019 | $1,904 | $31,164 | $17,314 | $13,850 |
| 2018 | $1,890 | $30,554 | $16,975 | $13,579 |
| 2017 | $1,865 | $29,956 | $16,643 | $13,313 |
| 2016 | $1,862 | $29,369 | $16,317 | $13,052 |
| 2015 | $1,867 | $28,928 | $16,072 | $12,856 |
| 2014 | -- | $28,100 | $15,600 | $12,500 |
Source: Public Records
Map
Nearby Homes
- 2990 S Martin Luther King Junior Blvd
- 998 E Jolson Ave
- 385 W Almy Ave
- 3232 S Elm Ave
- 1871 E Vine Ave
- 3155 S Walnut Ave
- 1775 E Vine Ave
- 1883 E Vine Ave
- 6394 S Cherry Ave
- 2554 S Poppy Ave
- 1246 E Grove Ave
- 2555 S Lotus Ave
- 2432 S Walnut Ave
- 3641 S Cherry Ave
- 2458 S Poppy Ave
- 2461 S Poppy Ave
- 2564 S Habitat Ave
- 2370 S Tupman St
- 2318 S Eunice Ave
- 2316 S Eunice Ave
- 936 E Chester Ave
- 1020 E Chester Ave
- 951 E Samson Ave
- 1005 E Samson Ave
- 1009 E Samson Ave
- 926 E Chester Ave
- 2933 S Weller Ave
- 931 E Samson Ave
- 945 E Chester Ave
- 1030 E Chester Ave
- 1021 E Samson Ave
- 916 E Chester Ave
- 931 E Chester Ave
- 1039 E Samson Ave
- 2929 S Weller Ave
- 2955 Martin L King Jr Blvd
- 909 E Chester Ave
- 2926 S Weller Ave
- 1025 E Chester Ave