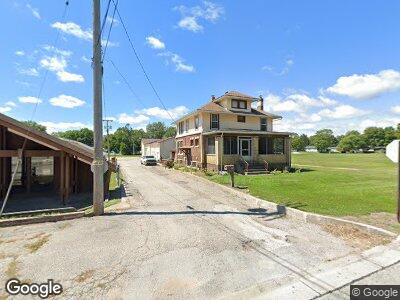
1010 Fox St La Porte, IN 46350
Estimated Value: $193,597 - $228,000
3
Beds
2
Baths
2,924
Sq Ft
$70/Sq Ft
Est. Value
About This Home
This home is located at 1010 Fox St, La Porte, IN 46350 and is currently estimated at $203,399, approximately $69 per square foot. 1010 Fox St is a home located in LaPorte County with nearby schools including Handley Elementary School, La Porte High School, and St. John's Lutheran School.
Ownership History
Date
Name
Owned For
Owner Type
Purchase Details
Closed on
Mar 18, 2024
Sold by
Chalik Properties Llc
Bought by
Fox St Investments Llc
Current Estimated Value
Purchase Details
Closed on
Mar 20, 2015
Sold by
A Bernacchi Greenhouses Inc
Bought by
Chalik Properties Llc
Create a Home Valuation Report for This Property
The Home Valuation Report is an in-depth analysis detailing your home's value as well as a comparison with similar homes in the area
Home Values in the Area
Average Home Value in this Area
Purchase History
| Date | Buyer | Sale Price | Title Company |
|---|---|---|---|
| Fox St Investments Llc | $250,000 | Acuity Title | |
| Chalik Properties Llc | -- | None Available |
Source: Public Records
Mortgage History
| Date | Status | Borrower | Loan Amount |
|---|---|---|---|
| Previous Owner | Angelo A Bernacchi Greenhouses Inc | $500,000 | |
| Previous Owner | A Bernacchi Greenhouses Inc | $500,000 | |
| Previous Owner | Bernacchi Greenhouses Inc | $400,000 |
Source: Public Records
Tax History Compared to Growth
Tax History
| Year | Tax Paid | Tax Assessment Tax Assessment Total Assessment is a certain percentage of the fair market value that is determined by local assessors to be the total taxable value of land and additions on the property. | Land | Improvement |
|---|---|---|---|---|
| 2024 | $1,625 | $108,000 | $26,300 | $81,700 |
| 2023 | $1,546 | $77,300 | $15,400 | $61,900 |
| 2022 | $1,546 | $77,300 | $15,900 | $61,400 |
| 2021 | $1,388 | $69,400 | $15,200 | $54,200 |
| 2020 | $1,388 | $69,400 | $16,300 | $53,100 |
| 2019 | $776 | $36,400 | $9,500 | $26,900 |
| 2018 | $804 | $37,800 | $9,500 | $28,300 |
| 2017 | $920 | $30,000 | $8,700 | $21,300 |
| 2016 | $2,527 | $84,900 | $25,900 | $59,000 |
| 2014 | $3,204 | $131,000 | $43,600 | $87,400 |
| 2013 | $3,126 | $104,200 | $22,800 | $81,400 |
Source: Public Records
Map
Nearby Homes