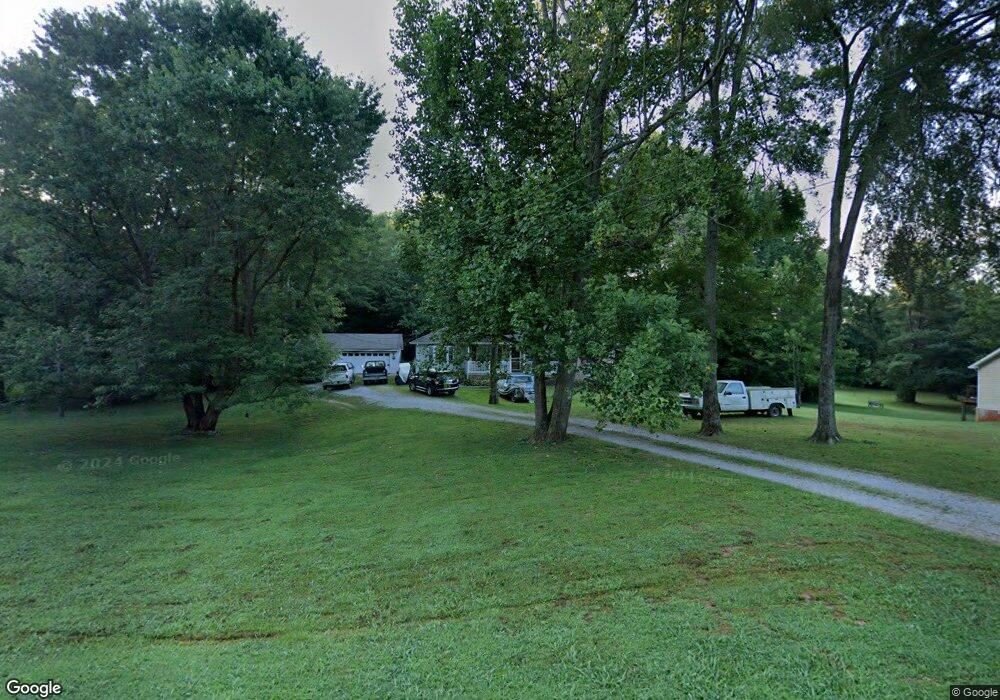
1010 Gill Rd Ashland City, TN 37015
Estimated Value: $358,545 - $377,000
--
Bed
2
Baths
1,700
Sq Ft
$214/Sq Ft
Est. Value
About This Home
This home is located at 1010 Gill Rd, Ashland City, TN 37015 and is currently estimated at $364,636, approximately $214 per square foot. 1010 Gill Rd is a home located in Cheatham County with nearby schools including Pleasant View Elementary School, Sycamore Middle School, and Sycamore High School.
Ownership History
Date
Name
Owned For
Owner Type
Purchase Details
Closed on
Jun 26, 2015
Sold by
Nash Larry D Barbara
Bought by
Williams Brian K Lindsey D
Current Estimated Value
Home Financials for this Owner
Home Financials are based on the most recent Mortgage that was taken out on this home.
Original Mortgage
$105,135
Outstanding Balance
$82,178
Interest Rate
3.93%
Mortgage Type
New Conventional
Estimated Equity
$282,458
Purchase Details
Closed on
Feb 16, 2006
Sold by
Breznican Jerry
Bought by
Williams Brian K
Home Financials for this Owner
Home Financials are based on the most recent Mortgage that was taken out on this home.
Original Mortgage
$126,416
Interest Rate
6.04%
Purchase Details
Closed on
Jun 30, 1994
Sold by
Williams Harold R
Bought by
Breznican Jerry
Purchase Details
Closed on
Oct 27, 1989
Bought by
Williams Harold Ralph and Williams Mary M
Purchase Details
Closed on
Jul 25, 1989
Bought by
Derry Robert and Derry Karen
Purchase Details
Closed on
Feb 29, 1988
Bought by
Reigle Daniel and Reigle Tina
Create a Home Valuation Report for This Property
The Home Valuation Report is an in-depth analysis detailing your home's value as well as a comparison with similar homes in the area
Home Values in the Area
Average Home Value in this Area
Purchase History
| Date | Buyer | Sale Price | Title Company |
|---|---|---|---|
| Williams Brian K Lindsey D | -- | -- | |
| Williams Brian K | $128,400 | -- | |
| Breznican Jerry | -- | -- | |
| Williams Harold Ralph | $62,200 | -- | |
| Derry Robert | $8,500 | -- | |
| Reigle Daniel | -- | -- |
Source: Public Records
Mortgage History
| Date | Status | Borrower | Loan Amount |
|---|---|---|---|
| Open | Williams Brian K Lindsey D | $105,135 | |
| Previous Owner | Reigle Daniel | $126,416 |
Source: Public Records
Tax History Compared to Growth
Tax History
| Year | Tax Paid | Tax Assessment Tax Assessment Total Assessment is a certain percentage of the fair market value that is determined by local assessors to be the total taxable value of land and additions on the property. | Land | Improvement |
|---|---|---|---|---|
| 2024 | $1,539 | $88,900 | $19,450 | $69,450 |
| 2023 | $1,405 | $49,350 | $4,400 | $44,950 |
| 2022 | $1,328 | $49,350 | $4,400 | $44,950 |
| 2021 | $1,328 | $49,350 | $4,400 | $44,950 |
| 2020 | $1,328 | $49,350 | $4,400 | $44,950 |
| 2019 | $1,328 | $49,350 | $4,400 | $44,950 |
| 2018 | $1,246 | $39,700 | $4,175 | $35,525 |
| 2017 | $1,179 | $39,700 | $4,175 | $35,525 |
| 2016 | $1,122 | $39,700 | $4,175 | $35,525 |
| 2015 | $1,030 | $34,100 | $4,175 | $29,925 |
| 2014 | $1,030 | $34,100 | $4,175 | $29,925 |
Source: Public Records
Map
Nearby Homes
- 3618 Sweethome Rd
- 3628 Sweethome Rd
- 3699 Sweethome Rd
- 1005 Highpoint Ln
- 1040 Heatherwood Rd
- 1069 Heatherwood Rd
- 0 Rustling Oaks Ct
- 1012 Spring Creek Rd
- 717 Jess Harris Rd
- 1101 Rustling Oaks Dr
- 1021 Tulip Dr
- 1248 Leaf Ln
- 1031 Leaf Ln
- 1231 Floyd Hudgens Rd
- 2044 Old Clarksville Pike
- 0 Poplar Ridge Ln
- 0 Thomasville Rd Unit RTC3000913
- 0 Thomasville Rd Unit RTC3000910
- 1772 Lockertsville Rd
- 185 Plantation Dr